Given two empirical measures \(\mu, \nu\) consisting of \(M\) and \(N\) observations, \(p\)-Wasserstein distance for \(p\geq 1\) between two empirical measures is defined as $$\mathcal{W}_p (\mu, \nu) = \left( \inf_{\gamma \in \Gamma(\mu, \nu)} \int_{\mathcal{M}\times \mathcal{M}} d(x,y)^p d \gamma(x,y) \right)^{1/p}$$ where \(\Gamma(\mu, \nu)\) denotes the collection of all measures/couplings on \(\mathcal{M}\times \mathcal{M}\) whose marginals are \(\mu\) and \(\nu\) on the first and second factors, respectively.
Usage
riem.wasserstein(
  riemobj1,
  riemobj2,
  p = 2,
  geometry = c("intrinsic", "extrinsic"),
  ...
)
Arguments
- riemobj1
a S3
"riemdata"class for \(M\) manifold-valued data, which are atoms of \(\mu\).- riemobj2
a S3
"riemdata"class for \(N\) manifold-valued data, which are atoms of \(\nu\).- p
an exponent for Wasserstein distance \(\mathcal{W}_p\) (default: 2).
- geometry
(case-insensitive) name of geometry; either geodesic (
"intrinsic") or embedded ("extrinsic") geometry.- ...
extra parameters including
- weight1
a length-\(M\) weight vector for \(\mu\); if
NULL(default), uniform weight is set.- weight2
a length-\(N\) weight vector for \(\nu\); if
NULL(default), uniform weight is set.
Value
a named list containing
- distance
\(\mathcal{W_p}\) distance between two empirical measures.
- plan
an \((M\times N)\) matrix whose rowSums and columnSums are
weight1andweight2respectively.
Examples
#-------------------------------------------------------------------
# Example on Sphere : a dataset with two types
#
# class 1 : 20 perturbed data points near (1,0,0) on S^2 in R^3
# class 2 : 30 perturbed data points near (0,1,0) on S^2 in R^3
#-------------------------------------------------------------------
## GENERATE DATA
mydata1 = list()
mydata2 = list()
for (i in 1:20){
tgt = c(1, stats::rnorm(2, sd=0.1))
mydata1[[i]] = tgt/sqrt(sum(tgt^2))
}
for (i in 1:30){
tgt = c(rnorm(1,sd=0.1),1,rnorm(1,sd=0.1))
mydata2[[i]] = tgt/sqrt(sum(tgt^2))
}
myriem1 = wrap.sphere(mydata1)
myriem2 = wrap.sphere(mydata2)
## COMPUTE p-WASSERSTEIN DISTANCES
dist1 = riem.wasserstein(myriem1, myriem2, p=1)
dist2 = riem.wasserstein(myriem1, myriem2, p=2)
dist5 = riem.wasserstein(myriem1, myriem2, p=5)
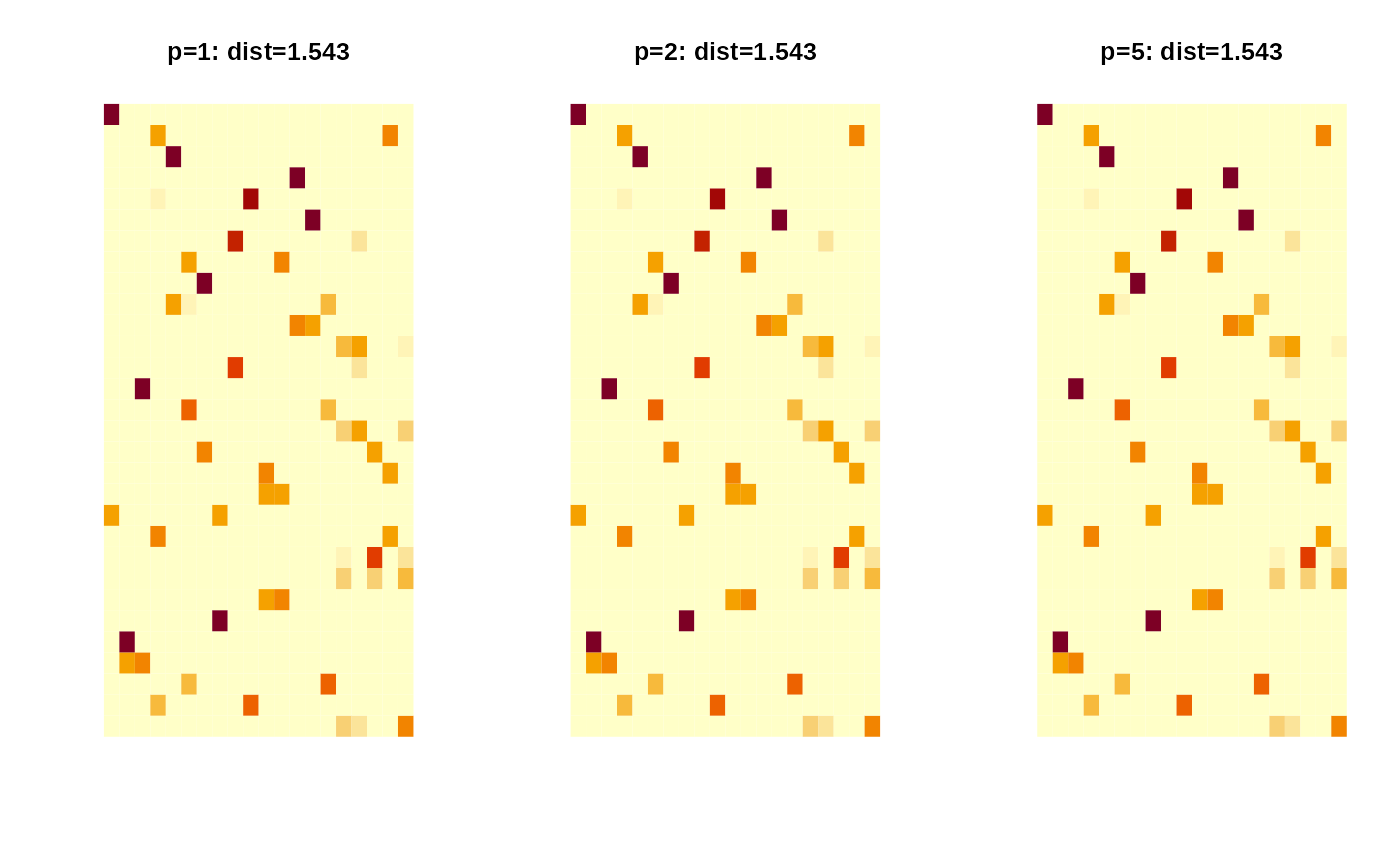
pm1 = paste0("p=1: dist=",round(dist1$distance,3))
pm2 = paste0("p=2: dist=",round(dist2$distance,3))
pm5 = paste0("p=5: dist=",round(dist5$distance,3))
## VISUALIZE TRANSPORT PLAN AND DISTANCE
opar <- par(no.readonly=TRUE)
par(mfrow=c(1,3))
image(dist1$plan, axes=FALSE, main=pm1)
image(dist2$plan, axes=FALSE, main=pm2)
image(dist5$plan, axes=FALSE, main=pm5)
 par(opar)