PHATE is a nonlinear manifold learning method that is specifically targeted at improving diffusion maps by incorporating data-adaptive kernel construction, detection of optimal time scale, and information-theoretic metric measures.
Usage
riem.phate(riemobj, ndim = 2, geometry = c("intrinsic", "extrinsic"), ...)Arguments
- riemobj
a S3
"riemdata"class for \(N\) manifold-valued data.- ndim
an integer-valued target dimension (default: 2).
- geometry
(case-insensitive) name of geometry; either geodesic (
"intrinsic") or embedded ("extrinsic") geometry.- ...
extra parameters for
PHATEincluding- nbdk
size of nearest neighborhood (default: 5).
- alpha
decay parameter for Gaussian kernel exponent (default: 2).
- potential
type of potential distance transformation;
"log"or"sqrt"(default:"log").
Value
a named list containing
- embed
an \((N\times ndim)\) matrix whose rows are embedded observations.
References
Moon KR, van Dijk D, Wang Z, Gigante S, Burkhardt DB, Chen WS, Yim K, van den Elzen A, Hirn MJ, Coifman RR, Ivanova NB, Wolf G, Krishnaswamy S (2019). “Visualizing Structure and Transitions in High-Dimensional Biological Data.” Nature Biotechnology, 37(12), 1482–1492. ISSN 1087-0156, 1546-1696.
Examples
# \donttest{
#-------------------------------------------------------------------
# Example on Sphere : a dataset with three types
#
# 10 perturbed data points near (1,0,0) on S^2 in R^3
# 10 perturbed data points near (0,1,0) on S^2 in R^3
# 10 perturbed data points near (0,0,1) on S^2 in R^3
#-------------------------------------------------------------------
## GENERATE DATA
mydata = list()
for (i in 1:10){
tgt = c(1, stats::rnorm(2, sd=0.1))
mydata[[i]] = tgt/sqrt(sum(tgt^2))
}
for (i in 11:20){
tgt = c(rnorm(1,sd=0.1),1,rnorm(1,sd=0.1))
mydata[[i]] = tgt/sqrt(sum(tgt^2))
}
for (i in 21:30){
tgt = c(stats::rnorm(2, sd=0.1), 1)
mydata[[i]] = tgt/sqrt(sum(tgt^2))
}
myriem = wrap.sphere(mydata)
mylabs = rep(c(1,2,3), each=10)
## PHATE EMBEDDING WITH LOG & SQRT POTENTIAL
phate_log = riem.phate(myriem, potential="log")$embed
phate_sqrt = riem.phate(myriem, potential="sqrt")$embed
embed_mds = riem.mds(myriem)$embed
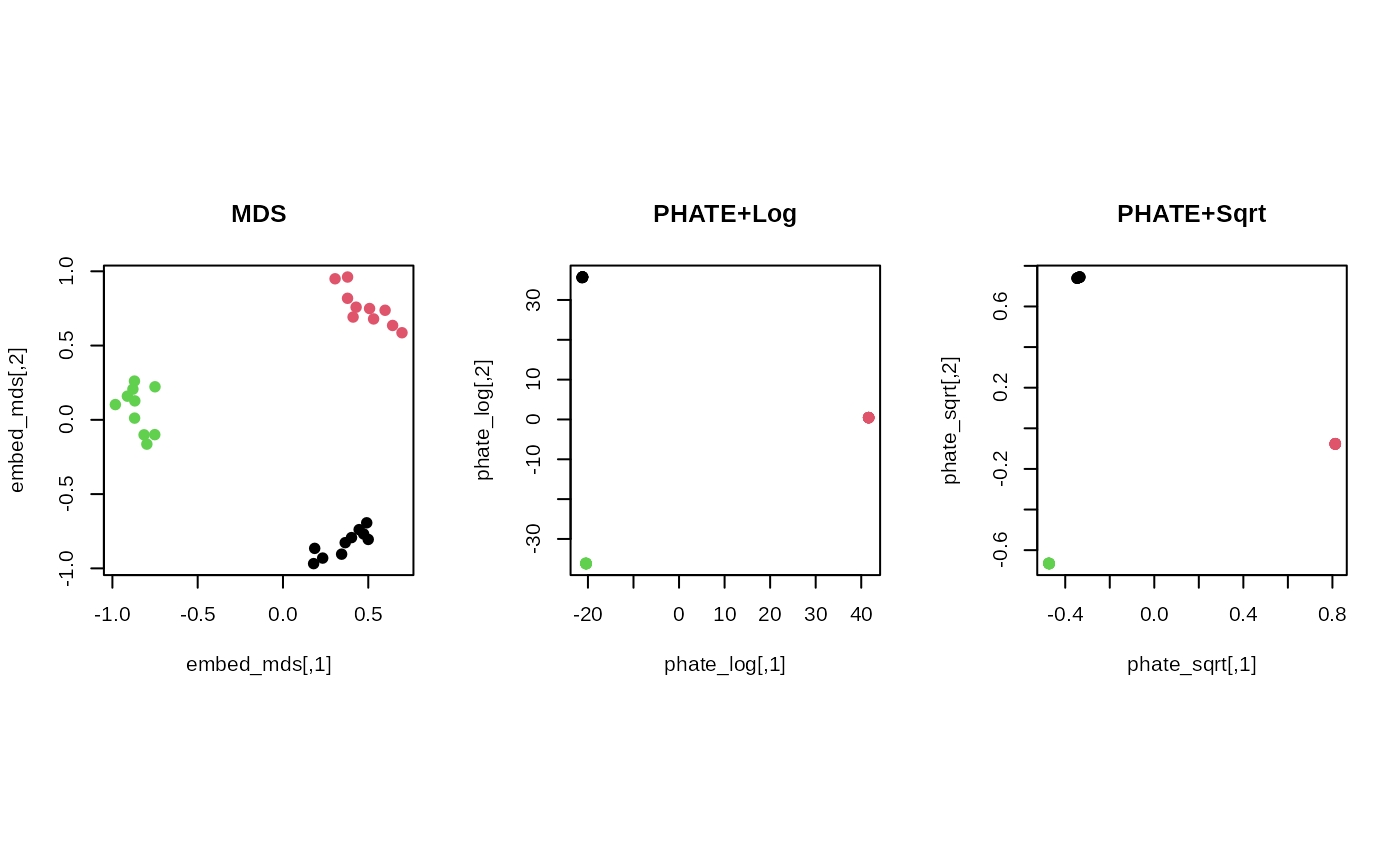
## VISUALIZE
opar = par(no.readonly=TRUE)
par(mfrow=c(1,3), pty="s")
plot(embed_mds, col=mylabs, pch=19, main="MDS" )
plot(phate_log, col=mylabs, pch=19, main="PHATE+Log")
plot(phate_sqrt, col=mylabs, pch=19, main="PHATE+Sqrt")
 par(opar)
# }
par(opar)
# }