Given \(N\) observations \(X_1, X_2, \ldots, X_N \in \mathcal{M}\),
compute Fréchet mean and variation with respect to the geometry by minimizing
$$\textrm{min}_x \sum_{n=1}^N w_n \rho^2 (x, x_n),\quad x\in\mathcal{M}$$ where
\(\rho (x, y)\) is a distance for two points \(x,y\in\mathcal{M}\).
If non-uniform weights are given, normalized version of the mean is computed
and if weight=NULL, it automatically sets equal weights (\(w_i = 1/n\)) for all observations.
Usage
riem.mean(riemobj, weight = NULL, geometry = c("intrinsic", "extrinsic"), ...)Arguments
- riemobj
a S3
"riemdata"class for \(N\) manifold-valued data.- weight
weight of observations; if
NULLit assumes equal weights, or a nonnegative length-\(N\) vector that sums to 1 should be given.- geometry
(case-insensitive) name of geometry; either geodesic (
"intrinsic") or embedded ("extrinsic") geometry.- ...
extra parameters including
- maxiter
maximum number of iterations to be run (default:50).
- eps
tolerance level for stopping criterion (default: 1e-5).
Value
a named list containing
- mean
a mean matrix on \(\mathcal{M}\).
- variation
sum of (weighted) squared distances.
Examples
#-------------------------------------------------------------------
# Example on Sphere : points near (0,1) on S^1 in R^2
#-------------------------------------------------------------------
## GENERATE DATA
ndata = 50
mydat = array(0,c(ndata,2))
for (i in 1:ndata){
tgt = c(stats::rnorm(1, sd=2), 1)
mydat[i,] = tgt/sqrt(sum(tgt^2))
}
myriem = wrap.sphere(mydat)
## COMPUTE TWO MEANS
mean.int = as.vector(riem.mean(myriem, geometry="intrinsic")$mean)
mean.ext = as.vector(riem.mean(myriem, geometry="extrinsic")$mean)
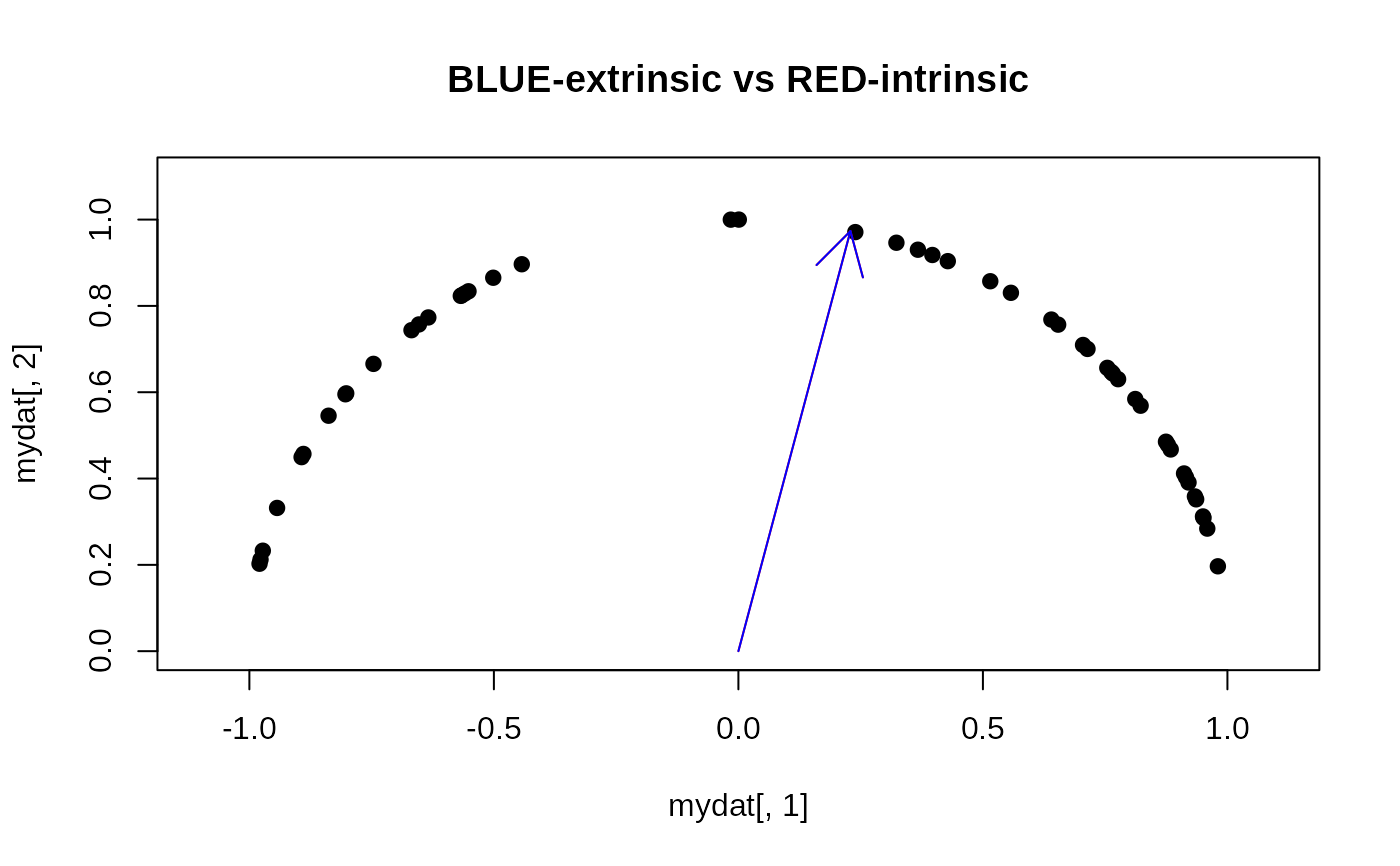
## VISUALIZE
opar <- par(no.readonly=TRUE)
plot(mydat[,1], mydat[,2], pch=19, xlim=c(-1.1,1.1), ylim=c(0,1.1),
main="BLUE-extrinsic vs RED-intrinsic")
arrows(x0=0,y0=0,x1=mean.int[1],y1=mean.int[2],col="red")
arrows(x0=0,y0=0,x1=mean.ext[1],y1=mean.ext[2],col="blue")
 par(opar)