Kernel Semi-Supervised Discriminant Analysis (KSDA) is a nonlinear variant of
SDA (do.sda). For simplicity, we enabled heat/gaussian kernel only.
Note that this method is quite sensitive to choices of
parameters, alpha, beta, and t. Especially when data
are well separated in the original space, it may lead to unsatisfactory results.
do.ksda(
  X,
  label,
  ndim = 2,
  type = c("proportion", 0.1),
  alpha = 1,
  beta = 1,
  t = 1
)
Arguments
- X
an \((n\times p)\) matrix or data frame whose rows are observations and columns represent independent variables.
- label
a length-\(n\) vector of data class labels.
- ndim
an integer-valued target dimension.
- type
a vector of neighborhood graph construction. Following types are supported;
c("knn",k),c("enn",radius), andc("proportion",ratio). Default isc("proportion",0.1), connecting about 1/10 of nearest data points among all data points. See alsoaux.graphnbdfor more details.- alpha
balancing parameter between model complexity and empirical loss.
- beta
Tikhonov regularization parameter.
- t
bandwidth parameter for heat kernel.
Value
a named list containing
- Y
an \((n\times ndim)\) matrix whose rows are embedded observations.
- trfinfo
a list containing information for out-of-sample prediction.
References
Cai D, He X, Han J (2007). “Semi-Supervised Discriminant Analysis.” In 2007 IEEE 11th International Conference on Computer Vision, 1--7.
See also
Examples
## generate data of 3 types with clear difference
set.seed(100)
dt1  = aux.gensamples(n=20)-100
dt2  = aux.gensamples(n=20)
dt3  = aux.gensamples(n=20)+100

## merge the data and create a label correspondingly
X      = rbind(dt1,dt2,dt3)
label  = rep(1:3, each=20)

## copy a label and let 10% of elements be missing
nlabel = length(label)
nmissing = round(nlabel*0.10)
label_missing = label
label_missing[sample(1:nlabel, nmissing)]=NA

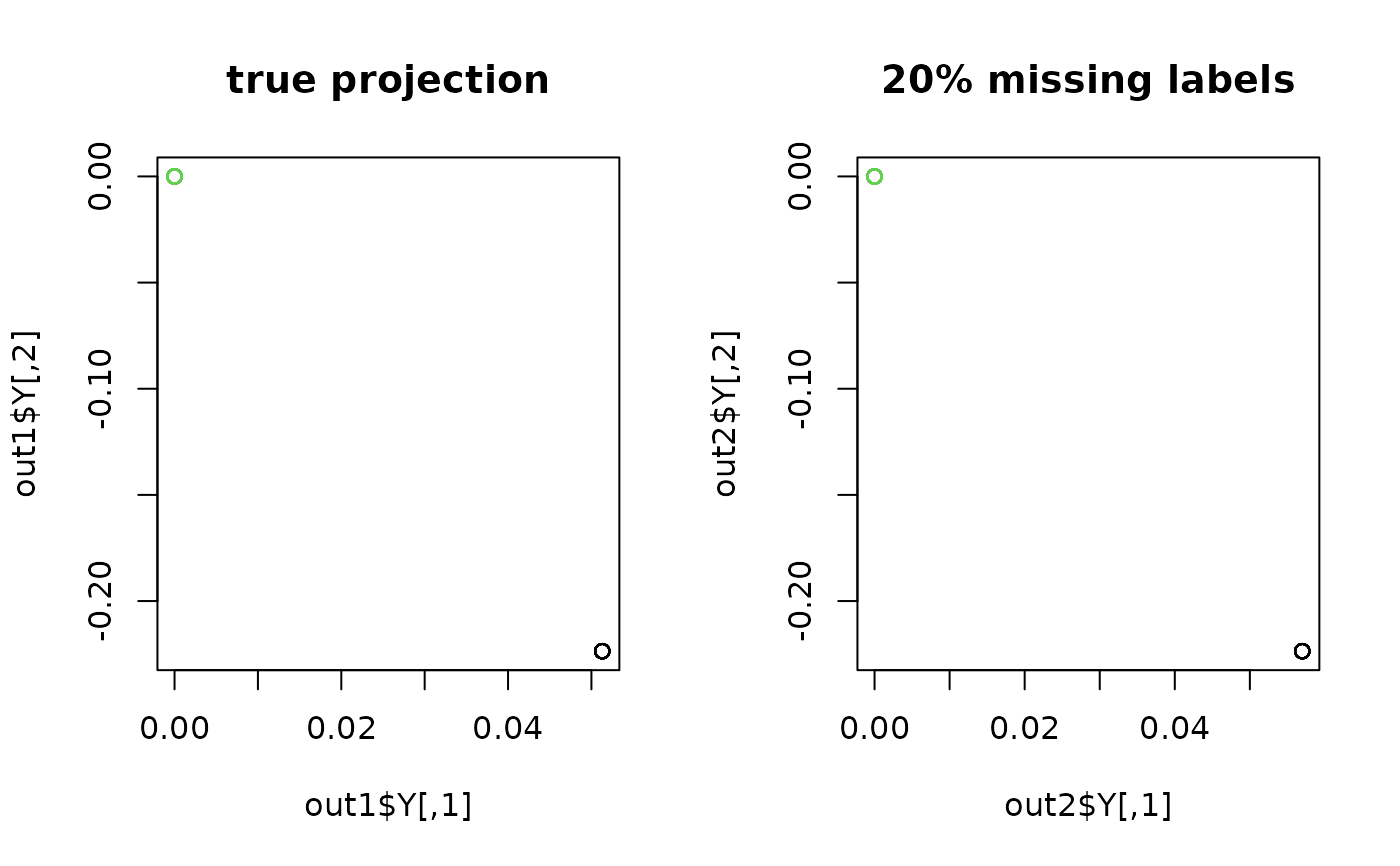
## compare true case with missing-label case
out1 = do.ksda(X, label, beta=0, t=0.1)
#> * Semi-Supervised Learning : there is no missing labels. Consider using Supervised methods.
out2 = do.ksda(X, label_missing, beta=0, t=0.1)

## visualize
opar = par(no.readonly=TRUE)
par(mfrow=c(1,2))
plot(out1$Y, col=label, main="true projection")
plot(out2$Y, col=label, main="20% missing labels")

par(opar)