Semi-Supervised Discriminant Analysis (SDA) is a linear dimension reduction method
when label is partially missing, i.e., semi-supervised. The labeled data
points are used to maximize the separability between classes while
the unlabeled ones to estimate the intrinsic structure of the data.
Regularization in case of rank-deficient case is also supported via an \(\ell_2\)
scheme via beta.
do.sda(X, label, ndim = 2, type = c("proportion", 0.1), alpha = 1, beta = 1)Arguments
- X
an \((n\times p)\) matrix or data frame whose rows are observations and columns represent independent variables.
- label
a length-\(n\) vector of data class labels.
- ndim
an integer-valued target dimension.
- type
a vector of neighborhood graph construction. Following types are supported;
c("knn",k),c("enn",radius), andc("proportion",ratio). Default isc("proportion",0.1), connecting about 1/10 of nearest data points among all data points. See alsoaux.graphnbdfor more details.- alpha
balancing parameter between model complexity and empirical loss.
- beta
Tikhonov regularization parameter.
Value
a named list containing
- Y
an \((n\times ndim)\) matrix whose rows are embedded observations.
- trfinfo
a list containing information for out-of-sample prediction.
- projection
a \((p\times ndim)\) whose columns are basis for projection.
References
Cai D, He X, Han J (2007). “Semi-Supervised Discriminant Analysis.” In 2007 IEEE 11th International Conference on Computer Vision, 1–7.
Examples
## use iris data
data(iris)
X = as.matrix(iris[,1:4])
label = as.integer(iris$Species)
## copy a label and let 20% of elements be missing
nlabel = length(label)
nmissing = round(nlabel*0.20)
label_missing = label
label_missing[sample(1:nlabel, nmissing)]=NA
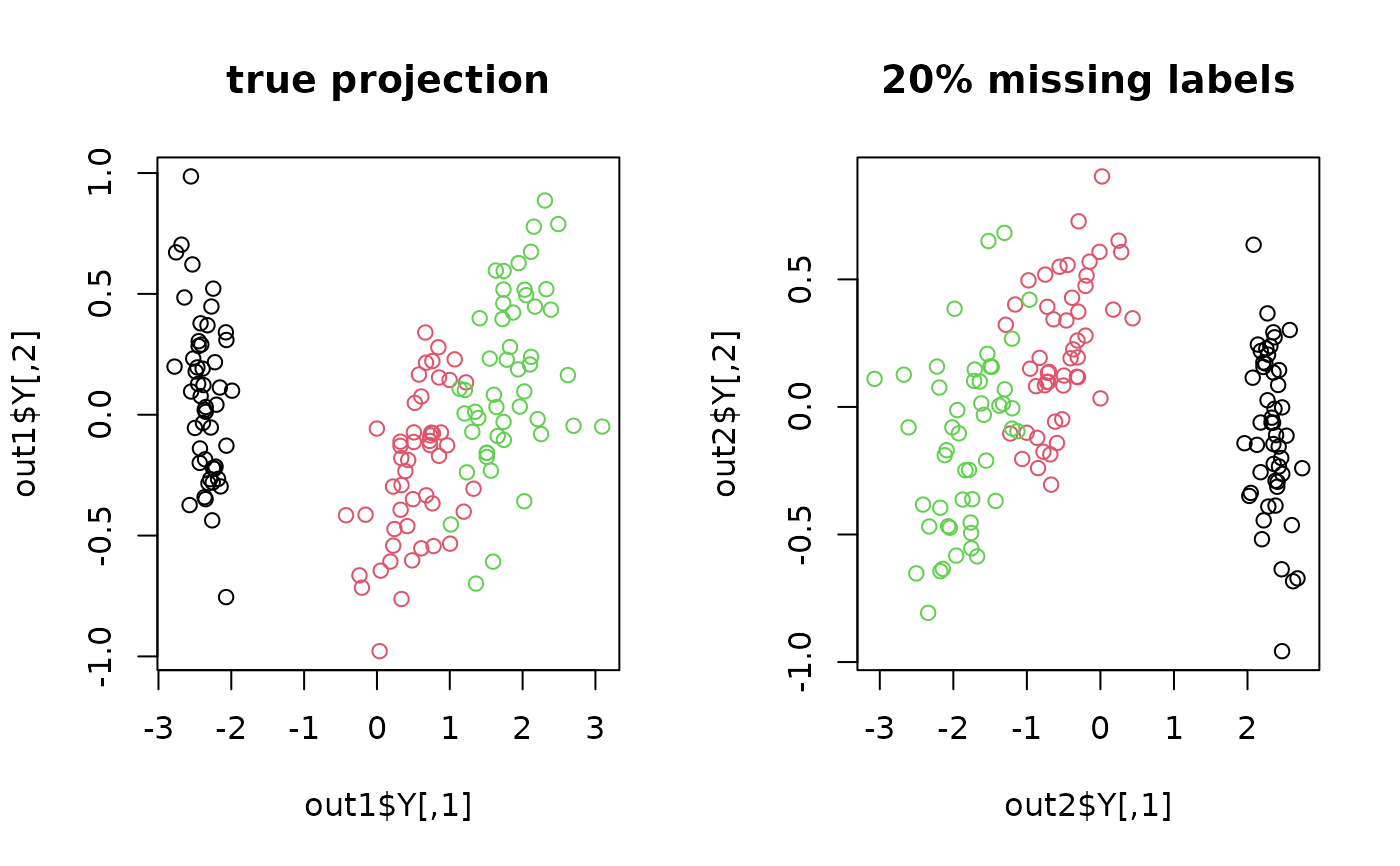
## compare true case with missing-label case
out1 = do.sda(X, label)
#> * Semi-Supervised Learning : there is no missing labels. Consider using Supervised methods.
out2 = do.sda(X, label_missing)
## visualize
opar <- par(no.readonly=TRUE)
par(mfrow=c(1,2))
plot(out1$Y, col=label, main="true projection")
plot(out2$Y, col=label, main="20% missing labels")
 par(opar)