Interactive Document Map originates from text analysis to generate maps of documents by placing
similar documents in the same neighborhood. After defining pairwise distance with cosine similarity,
authors asserted to use either NNP or FastMap as an engine behind.
Arguments
- X
an \((n\times p)\) matrix or data frame whose rows are observations and columns represent independent variables.
- ndim
an integer-valued target dimension.
- preprocess
an additional option for preprocessing the data. Default is "null". See also
aux.preprocessfor more details.- engine
either
NNPorFastMap.
Value
a named list containing
- Y
an \((n\times ndim)\) matrix whose rows are embedded observations.
- trfinfo
a list containing information for out-of-sample prediction.
References
Minghim R, Paulovich FV, de Andrade Lopes A (2006). “Content-Based Text Mapping Using Multi-Dimensional Projections for Exploration of Document Collections.” In Erbacher RF, Roberts JC, Gröhn MT, Börner K (eds.), Visualization and Data Analysis, 60600S.
See also
Examples
# \donttest{
## load iris data
data(iris)
set.seed(100)
subid = sample(1:150,50)
X = as.matrix(iris[subid,1:4])
lab = as.factor(iris[subid,5])
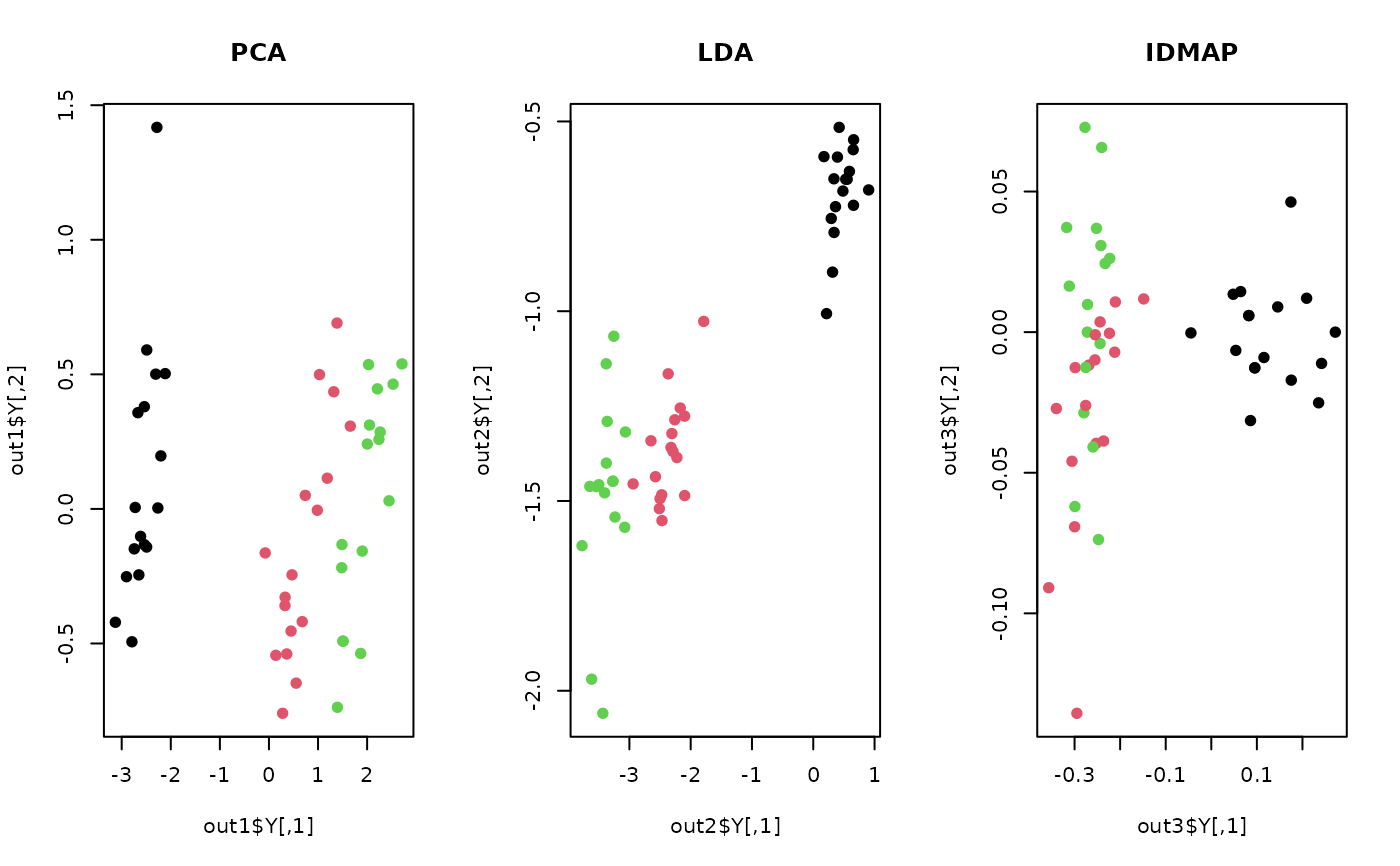
## let's compare with other methods
out1 <- do.pca(X, ndim=2)
out2 <- do.lda(X, ndim=2, label=lab)
out3 <- do.idmap(X, ndim=2, engine="NNP")
## visualize
opar <- par(no.readonly=TRUE)
par(mfrow=c(1,3))
plot(out1$Y, pch=19, col=lab, main="PCA")
plot(out2$Y, pch=19, col=lab, main="LDA")
plot(out3$Y, pch=19, col=lab, main="IDMAP")
 par(opar)
# }
par(opar)
# }