Local Affine Mulditimensional Projection (LAMP) can be considered as a nonlinear method even though each datum is projected using locally estimated affine mapping. It first finds a low-dimensional embedding for control points and then locates the rest data using affine mapping. We use \(\sqrt{n}\) number of data as controls and Stochastic Neighborhood Embedding is applied as an initial projection of control set. Note that this belongs to the method for visualization so projection onto \(\mathbf{R}^2\) is suggested for use.
do.lamp(X, ndim = 2)Arguments
- X
an \((n\times p)\) matrix or data frame whose rows are observations and columns represent independent variables.
- ndim
an integer-valued target dimension.
Value
a named Rdimtools S3 object containing
- Y
an \((n\times ndim)\) matrix whose rows are embedded observations.
- algorithm
name of the algorithm.
References
Joia P, Paulovich FV, Coimbra D, Cuminato JA, Nonato LG (2011). “Local Affine Multidimensional Projection.” IEEE Transactions on Visualization and Computer Graphics, 17(12), 2563--2571.
See also
Examples
# \donttest{
## load iris data
data(iris)
set.seed(100)
subid = sample(1:150,50)
X = as.matrix(iris[subid,1:4])
label = as.factor(iris[subid,5])
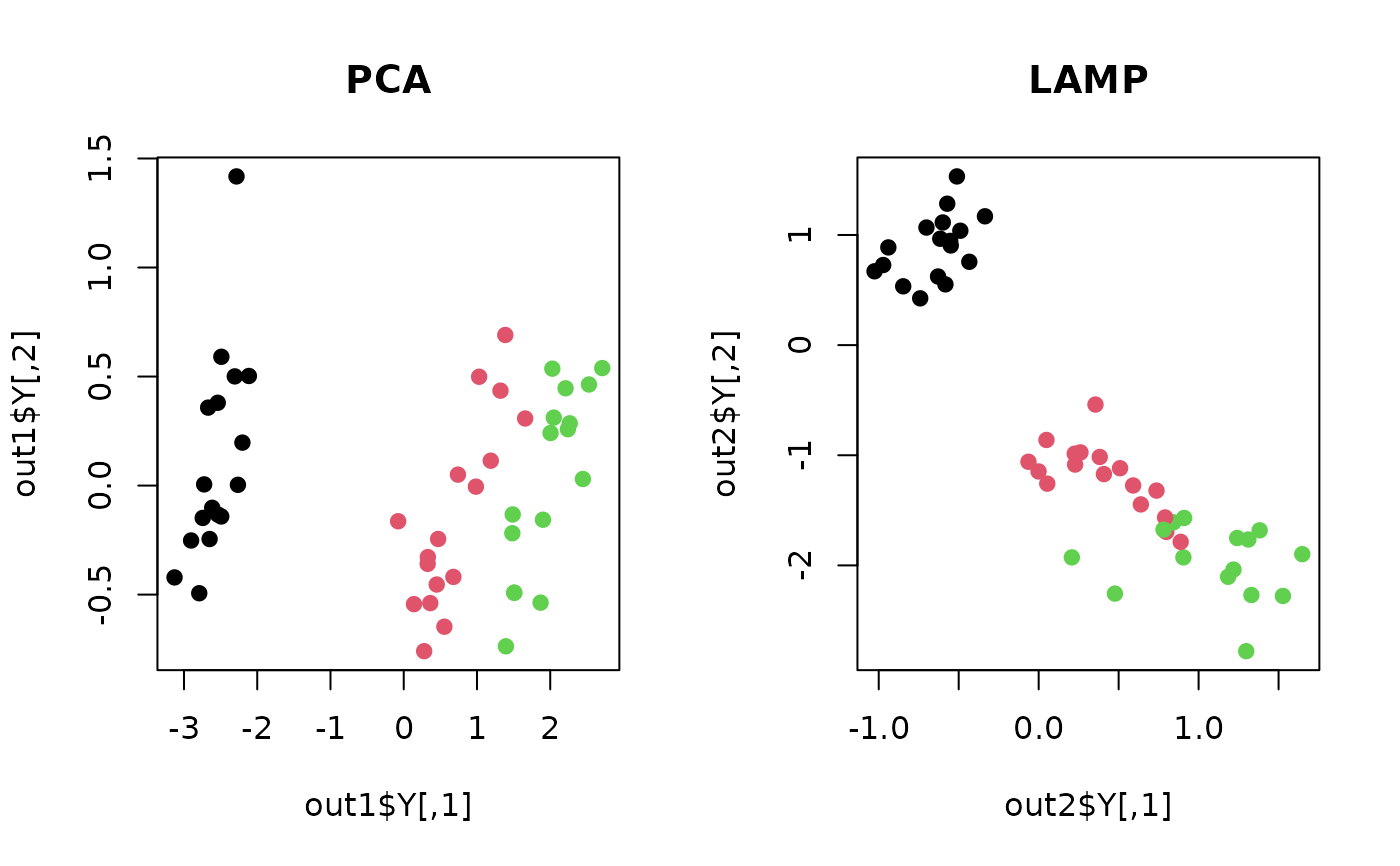
## let's compare with PCA
out1 <- do.pca(X, ndim=2) # PCA
out2 <- do.lamp(X, ndim=2) # LAMP
## visualize
opar <- par(no.readonly=TRUE)
par(mfrow=c(1,2))
plot(out1$Y, pch=19, col=label, main="PCA")
plot(out2$Y, pch=19, col=label, main="LAMP")
 par(opar)
# }
par(opar)
# }