Kernel principal component analysis (KPCA/Kernel PCA) is a nonlinear extension of classical PCA using techniques called kernel trick, a common method of introducing nonlinearity by transforming, usually, covariance structure or other gram-type estimate to make it flexible in Reproducing Kernel Hilbert Space.
Arguments
- X
an \((n\times p)\) matrix or data frame whose rows are observations and columns represent independent variables.
- ndim
an integer-valued target dimension.
- preprocess
an additional option for preprocessing the data. Default is "null". See also
aux.preprocessfor more details.- kernel
a vector containing name of a kernel and corresponding parameters. See also
aux.kernelcovfor complete description of Kernel Trick.
Value
a named list containing
- Y
an \((n\times ndim)\) matrix whose rows are embedded observations.
- trfinfo
a list containing information for out-of-sample prediction.
- vars
variances of projected data / eigenvalues from kernelized covariance matrix.
References
Schölkopf B, Smola A, Müller K (1997). “Kernel Principal Component Analysis.” In Goos G, Hartmanis J, van Leeuwen J, Gerstner W, Germond A, Hasler M, Nicoud J (eds.), Artificial Neural Networks — ICANN'97, volume 1327, 583–588. Springer Berlin Heidelberg, Berlin, Heidelberg. ISBN 978-3-540-63631-1 978-3-540-69620-9.
See also
Examples
# \donttest{
## load iris data
data(iris)
set.seed(100)
subid = sample(1:150,50)
X = as.matrix(iris[subid,1:4])
label = as.factor(iris[subid,5])
## try out different settings
output1 <- do.kpca(X) # default setting
output2 <- do.kpca(X,kernel=c("gaussian",5)) # gaussian kernel with large bandwidth
output3 <- do.kpca(X,kernel=c("laplacian",1)) # laplacian kernel
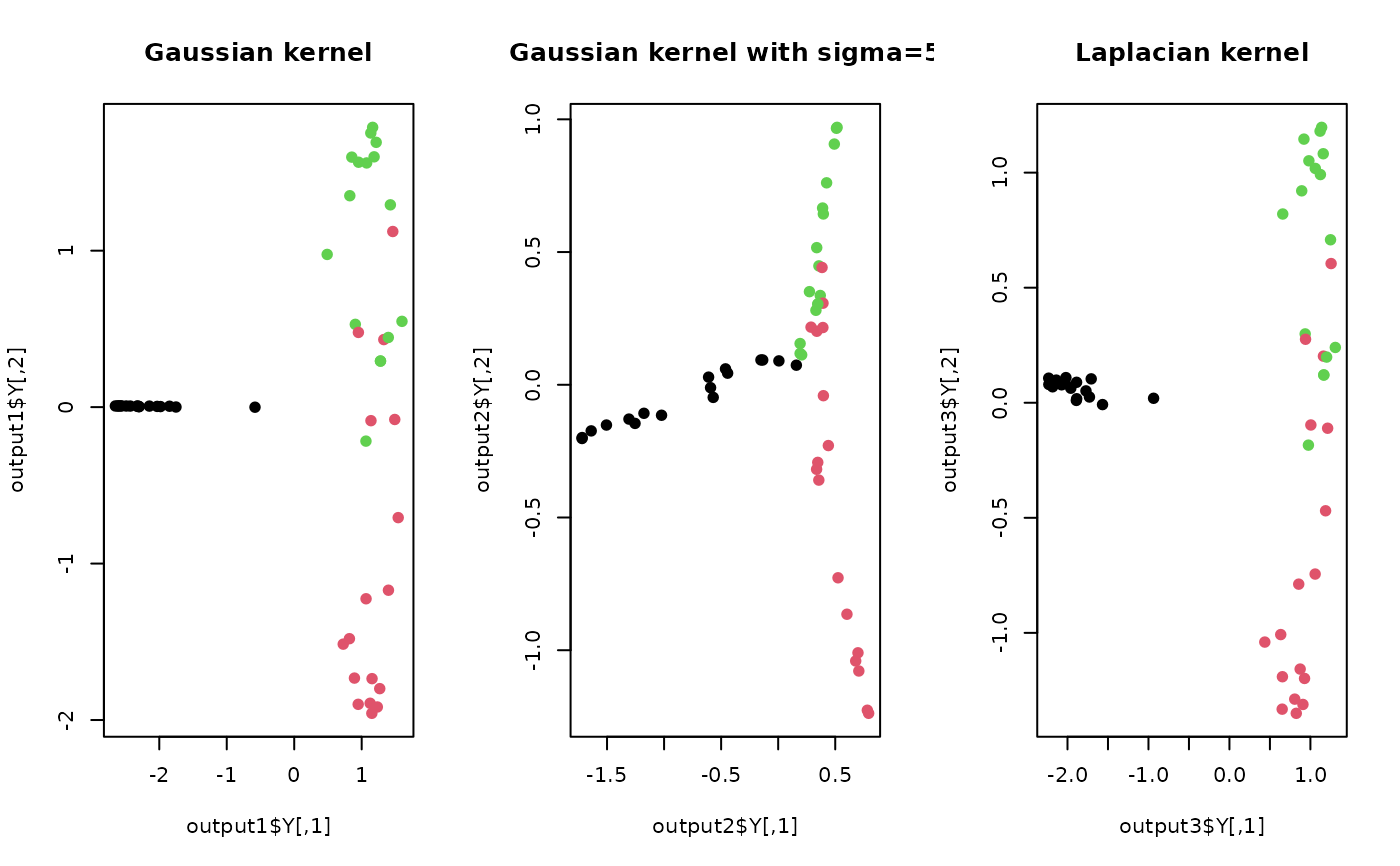
## visualize three different projections
opar <- par(no.readonly=TRUE)
par(mfrow=c(1,3))
plot(output1$Y, col=label, pch=19, main="Gaussian kernel")
plot(output2$Y, col=label, pch=19, main="Gaussian kernel with sigma=5")
plot(output3$Y, col=label, pch=19, main="Laplacian kernel")
 par(opar)
# }
par(opar)
# }