Kernel Local Discriminant Embedding (KLDE) is a variant of Local Discriminant Embedding in that it aims to preserve inter- and intra-class neighborhood information in a nonlinear manner using kernel trick. Note that the combination of kernel matrix and its eigendecomposition often suffers from lacking numerical rank. For such case, our algorithm returns a warning message and algorithm stops working any further due to its innate limitations of constructing weight matrix.
Arguments
- X
an \((n\times p)\) matrix or data frame whose rows are observations.
- label
a length-\(n\) vector of data class labels.
- ndim
an integer-valued target dimension.
- t
kernel bandwidth in \((0,\infty)\).
- numk
the number of neighboring points for k-nn graph construction.
- preprocess
an additional option for preprocessing the data. Default is "center". See also
aux.preprocessfor more details.- ktype
a vector containing name of a kernel and corresponding parameters. See also
aux.kernelcovfor complete description of Kernel Trick.- kcentering
a logical;
TRUEto use centered Kernel matrix,FALSEotherwise.
Value
a named list containing
- Y
an \((n\times ndim)\) matrix whose rows are embedded observations.
- trfinfo
a list containing information for out-of-sample prediction.
References
Hwann-Tzong Chen, Huang-Wei Chang, Tyng-Luh Liu (2005). “Local Discriminant Embedding and Its Variants.” In 2005 IEEE Computer Society Conference on Computer Vision and Pattern Recognition, volume 2, 846–853.
Examples
# \donttest{
## generate data of 2 types with clear difference
set.seed(100)
diff = 25
dt1 = aux.gensamples(n=50)-diff;
dt2 = aux.gensamples(n=50)+diff;
## merge the data and create a label correspondingly
X = rbind(dt1,dt2)
label = rep(1:2, each=50)
## try different neighborhood size
out1 <- do.klde(X, label, numk=5)
out2 <- do.klde(X, label, numk=10)
out3 <- do.klde(X, label, numk=20)
## visualize
opar = par(no.readonly=TRUE)
par(mfrow=c(1,3))
plot(out1$Y, col=label, pch=19, main="k=5")
plot(out2$Y, col=label, pch=19, main="k=10")
plot(out3$Y, col=label, pch=19, main="k=20")
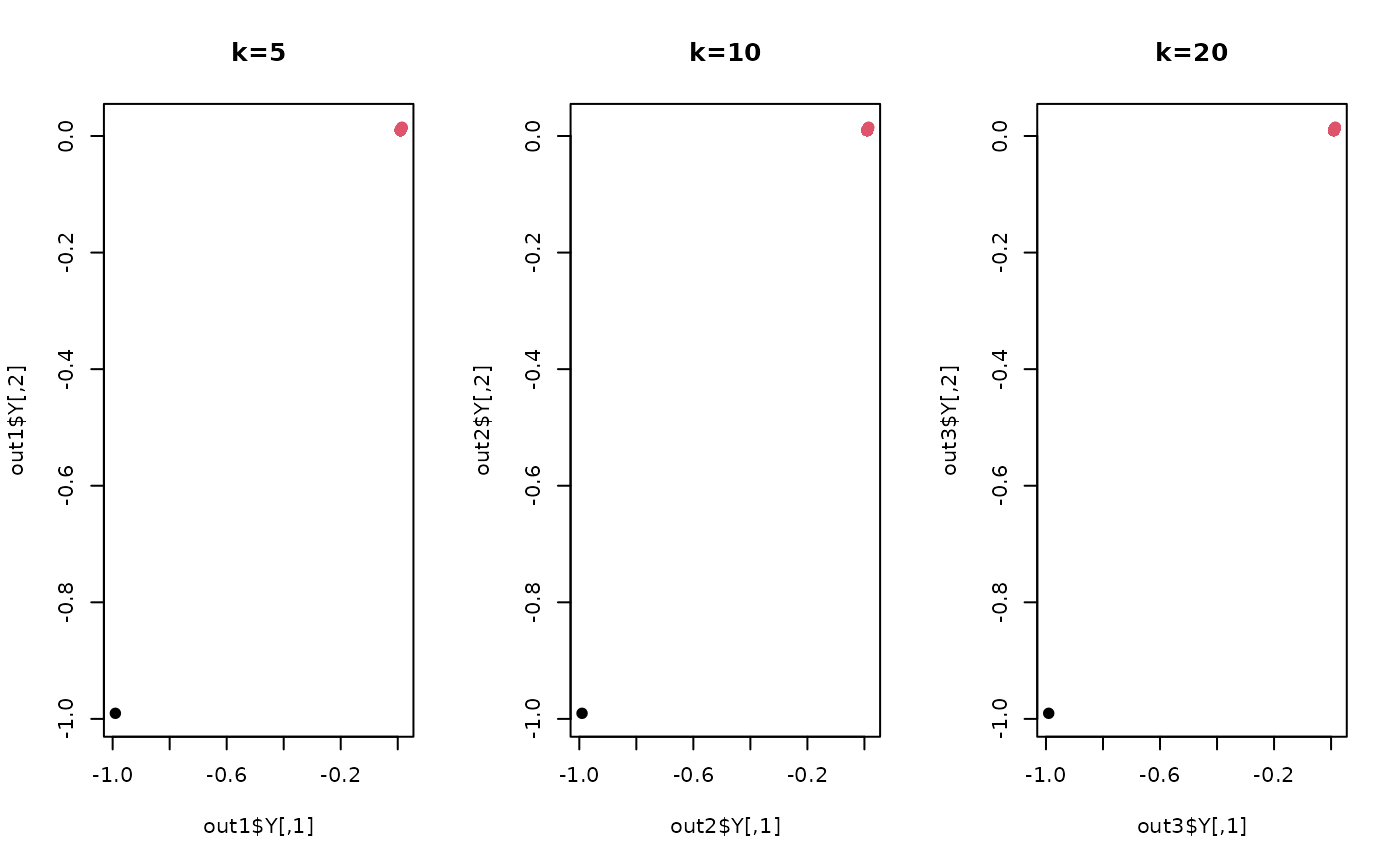 par(opar)
# }
par(opar)
# }