Local Fisher Discriminant Analysis (LFDA) is a linear dimension reduction method for supervised case, i.e., labels are given. It reflects local information to overcome undesired results of traditional Fisher Discriminant Analysis which results in a poor mapping when samples in a single class form form several separate clusters.
Arguments
- X
an \((n\times p)\) matrix or data frame whose rows are observations and columns represent independent variables.
- label
a length-\(n\) vector of data class labels.
- ndim
an integer-valued target dimension.
- preprocess
an additional option for preprocessing the data. Default is "center". See also
aux.preprocessfor more details.- type
a vector of neighborhood graph construction. Following types are supported;
c("knn",k),c("enn",radius), andc("proportion",ratio). Default isc("proportion",0.1), connecting about 1/10 of nearest data points among all data points. See alsoaux.graphnbdfor more details.- symmetric
one of
"intersect","union"or"asymmetric"is supported. Default is"union". See alsoaux.graphnbdfor more details.- localscaling
TRUEto use local scaling method for construction affinity matrix,FALSEfor binary affinity.
Value
a named list containing
- Y
an \((n\times ndim)\) matrix whose rows are embedded observations.
- projection
a \((p\times ndim)\) whose columns are basis for projection.
- trfinfo
a list containing information for out-of-sample prediction.
References
Sugiyama M (2006). “Local Fisher Discriminant Analysis for Supervised Dimensionality Reduction.” In Proceedings of the 23rd International Conference on Machine Learning, 905–912.
Zelnik-manor L, Perona P (2005). “Self-Tuning Spectral Clustering.” In Saul LK, Weiss Y, Bottou L (eds.), Advances in Neural Information Processing Systems 17, 1601–1608. MIT Press.
Examples
## generate 3 different groups of data X and label vector
x1 = matrix(rnorm(4*10), nrow=10)-20
x2 = matrix(rnorm(4*10), nrow=10)
x3 = matrix(rnorm(4*10), nrow=10)+20
X = rbind(x1, x2, x3)
label = rep(1:3, each=10)
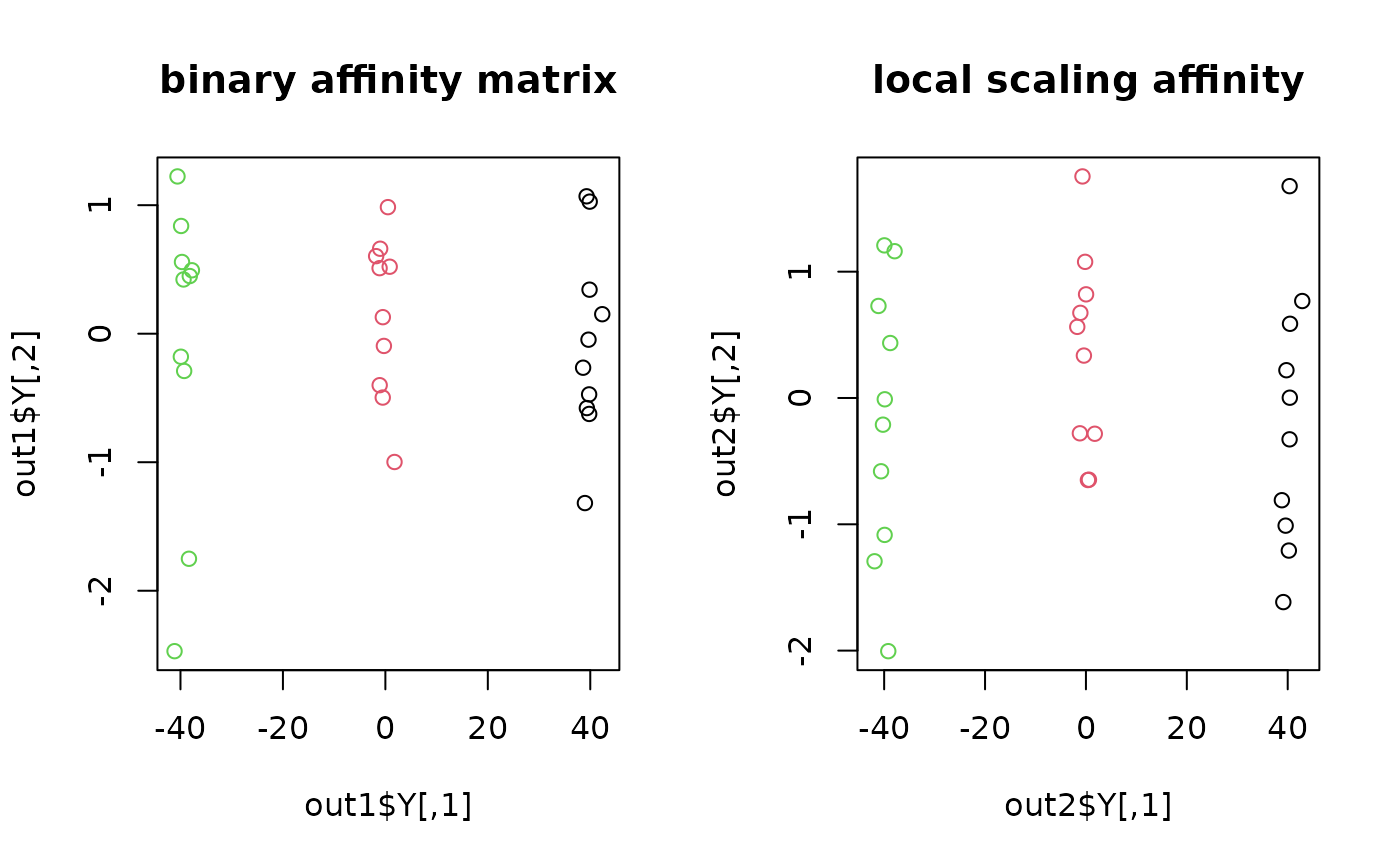
## try different affinity matrices
out1 = do.lfda(X, label)
out2 = do.lfda(X, label, localscaling=FALSE)
## visualize
opar <- par(no.readonly=TRUE)
par(mfrow=c(1,2))
plot(out1$Y, col=label, main="binary affinity matrix")
plot(out2$Y, col=label, main="local scaling affinity")
 par(opar)