Built upon do.wdfs, this method selects features step-by-step to opt out the redundant sets
by iteratively update feature scores via scaling by the correlation between target and previously chosen variables.
do.uwdfs(
  X,
  label,
  ndim = 2,
  preprocess = c("null", "center", "scale", "cscale", "decorrelate", "whiten")
)
Arguments
- X
an \((n\times p)\) matrix or data frame whose rows are observations and columns represent independent variables.
- label
a length-\(n\) vector of data class labels.
- ndim
an integer-valued target dimension.
- preprocess
an additional option for preprocessing the data. Default is "null". See also
aux.preprocessfor more details.
Value
a named list containing
- Y
an \((n\times ndim)\) matrix whose rows are embedded observations.
- featidx
a length-\(ndim\) vector of indices with highest scores.
- trfinfo
a list containing information for out-of-sample prediction.
- projection
a \((p\times ndim)\) whose columns are basis for projection.
References
Liao S, Gao Q, Nie F, Liu Y, Zhang X (2019). “Worst-Case Discriminative Feature Selection.” In Proceedings of the Twenty-Eighth International Joint Conference on Artificial Intelligence, IJCAI-19, 2973--2979.
See also
Examples
# \donttest{
## use iris data
## it is known that feature 3 and 4 are more important.
data(iris)
set.seed(100)
subid = sample(1:150,50)
iris.dat = as.matrix(iris[subid,1:4])
iris.lab = as.factor(iris[subid,5])
## compare with other algorithms
out1 = do.lda(iris.dat, iris.lab)
out2 = do.wdfs(iris.dat, iris.lab)
out3 = do.uwdfs(iris.dat, iris.lab)
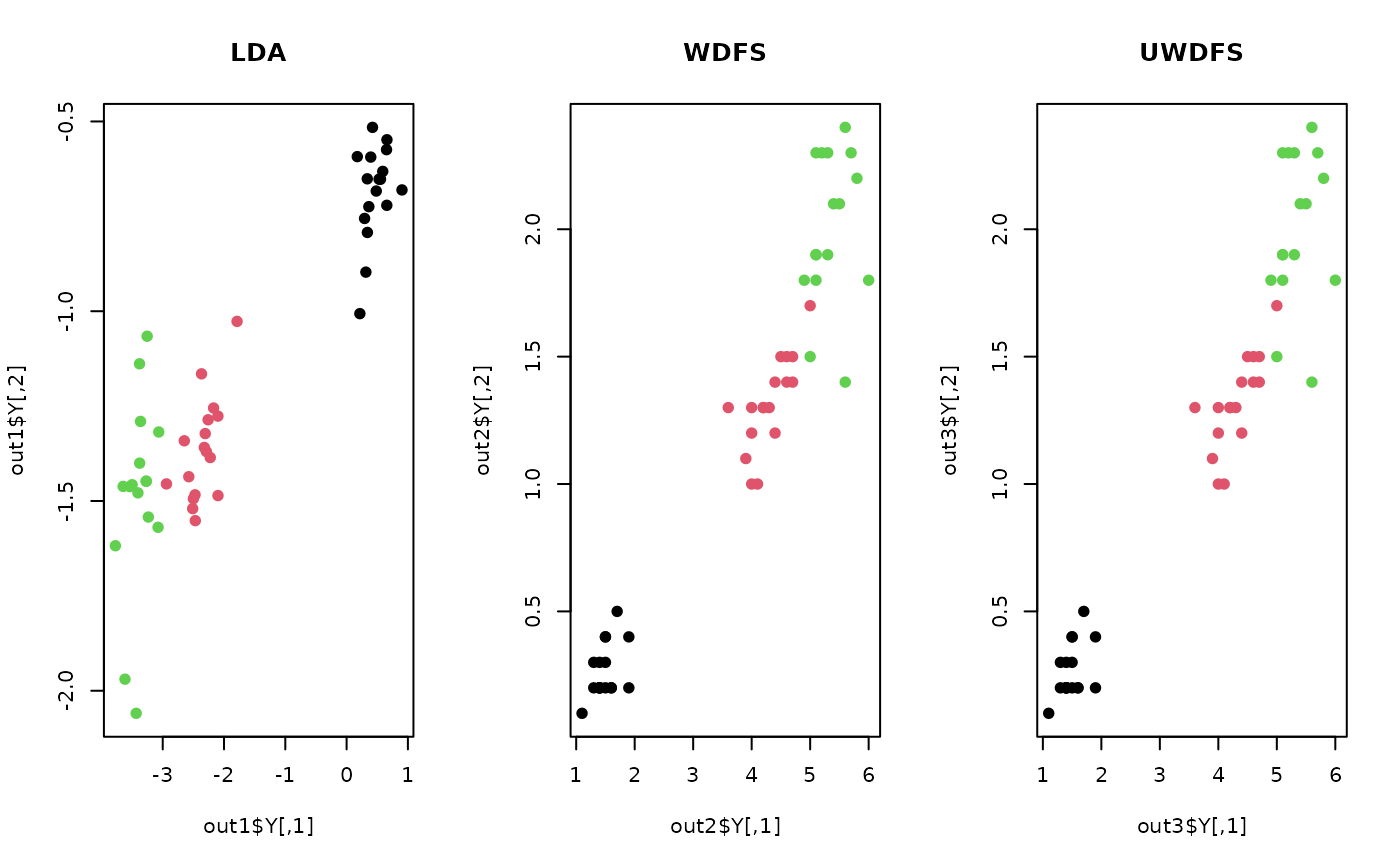
## visualize
opar <- par(no.readonly=TRUE)
par(mfrow=c(1,3))
plot(out1$Y, pch=19, col=iris.lab, main="LDA")
plot(out2$Y, pch=19, col=iris.lab, main="WDFS")
plot(out3$Y, pch=19, col=iris.lab, main="UWDFS")
 par(opar)
# }
par(opar)
# }