Locality Sensitive Laplacian Score (LSLS) is a supervised linear feature extraction method that combines a feature selection framework of laplacian score where the graph laplacian is adjusted as in the scheme of LSDA. The adjustment is taken via decomposed affinity matrices which are separately constructed using the provided class label information.
do.lsls(
  X,
  label,
  ndim = 2,
  alpha = 0.5,
  k = 5,
  preprocess = c("null", "center", "scale", "cscale", "decorrelate", "whiten")
)
Arguments
- X
an \((n\times p)\) matrix or data frame whose rows are observations and columns represent independent variables.
- label
a length-\(n\) vector of data class labels.
- ndim
an integer-valued target dimension.
- alpha
a weight factor; should be a real number in \([0,1]\).
- k
an integer; the size of a neighborhood.
- preprocess
an additional option for preprocessing the data. Default is "null". See also
aux.preprocessfor more details.
Value
a named list containing
- Y
an \((n\times ndim)\) matrix whose rows are embedded observations.
- featidx
a length-\(ndim\) vector of indices with highest scores.
- trfinfo
a list containing information for out-of-sample prediction.
- projection
a \((p\times ndim)\) whose columns are basis for projection.
References
Liao B, Jiang Y, Liang W, Zhu W, Cai L, Cao Z (2014). “Gene Selection Using Locality Sensitive Laplacian Score.” IEEE/ACM Transactions on Computational Biology and Bioinformatics, 11(6), 1146–1156.
Examples
# \donttest{
## use iris data
## it is known that feature 3 and 4 are more important.
data(iris)
set.seed(100)
subid = sample(1:150,50)
iris.dat = as.matrix(iris[subid,1:4])
iris.lab = as.factor(iris[subid,5])
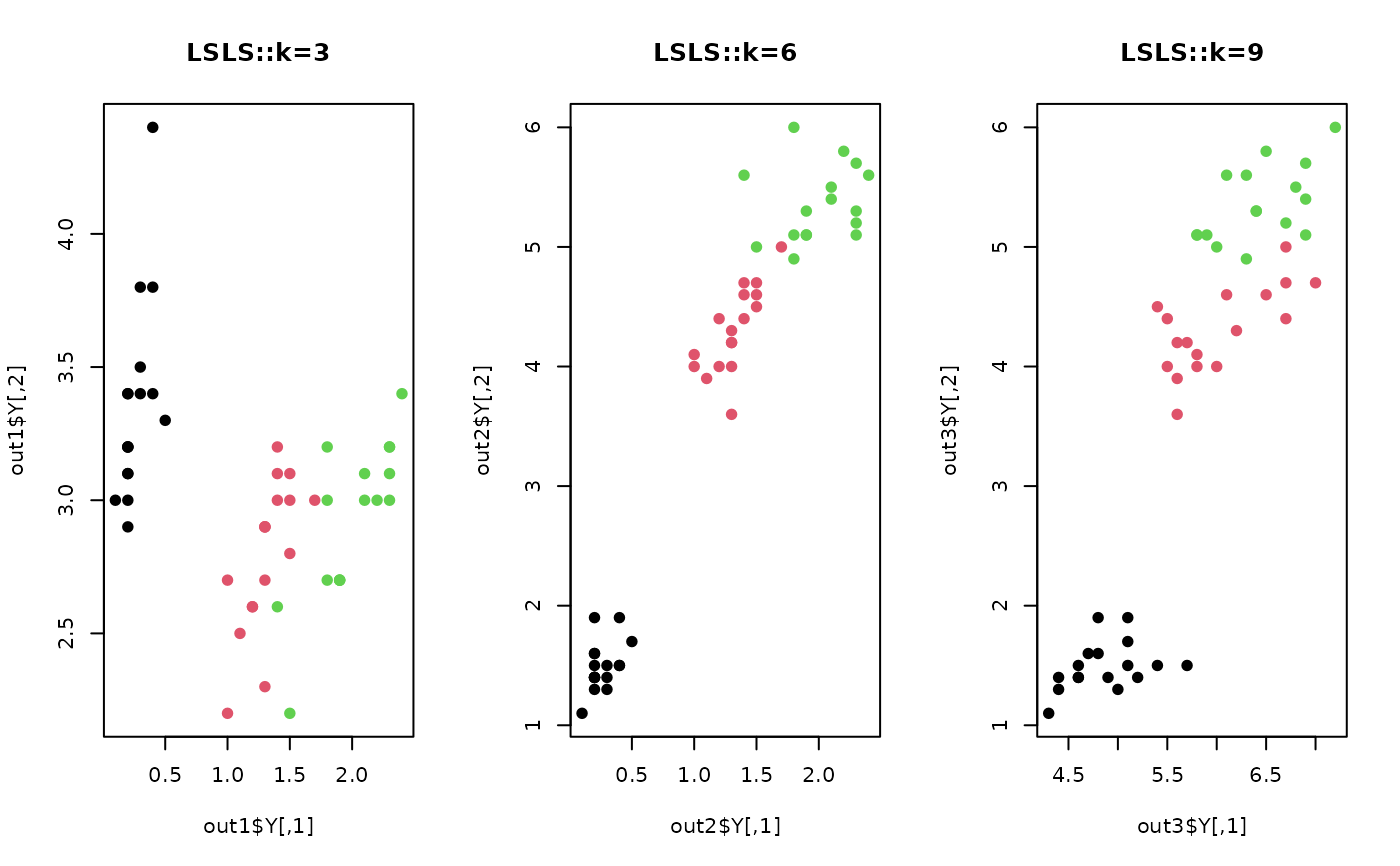
## compare different neighborhood sizes
out1 = do.lsls(iris.dat, iris.lab, k=3)
out2 = do.lsls(iris.dat, iris.lab, k=6)
out3 = do.lsls(iris.dat, iris.lab, k=9)
## visualize
opar <- par(no.readonly=TRUE)
par(mfrow=c(1,3))
plot(out1$Y, col=iris.lab, pch=19, main="LSLS::k=3")
plot(out2$Y, col=iris.lab, pch=19, main="LSLS::k=6")
plot(out3$Y, col=iris.lab, pch=19, main="LSLS::k=9")
 par(opar)
# }
par(opar)
# }