Locality Sensitive Discriminant Analysis (LSDA) is a supervised linear method. It aims at finding a projection which maximizes the margin between data points from different classes at each local area in which the nearby points with the same label are close to each other while the nearby points with different labels are far apart.
Arguments
- X
an \((n\times p)\) matrix or data frame whose rows are observations and columns represent independent variables.
- label
a length-\(n\) vector of data class labels.
- ndim
an integer-valued target dimension.
- preprocess
an additional option for preprocessing the data. Default is "center". See also
aux.preprocessfor more details.- alpha
balancing parameter for between- and within-class scatter in \([0,1]\).
- k1
the number of same-class neighboring points (homogeneous neighbors).
- k2
the number of different-class neighboring points (heterogeneous neighbors).
Value
a named list containing
- Y
an \((n\times ndim)\) matrix whose rows are embedded observations.
- trfinfo
a list containing information for out-of-sample prediction.
- projection
a \((p\times ndim)\) whose columns are basis for projection.
References
Cai D, He X, Zhou K, Han J, Bao H (2007). “Locality Sensitive Discriminant Analysis.” In Proceedings of the 20th International Joint Conference on Artifical Intelligence, IJCAI'07, 708–713.
Examples
## create a data matrix with clear difference
x1 = matrix(rnorm(4*10), nrow=10)-20
x2 = matrix(rnorm(4*10), nrow=10)
x3 = matrix(rnorm(4*10), nrow=10)+20
X = rbind(x1, x2, x3)
label = c(rep(1,10), rep(2,10), rep(3,10))
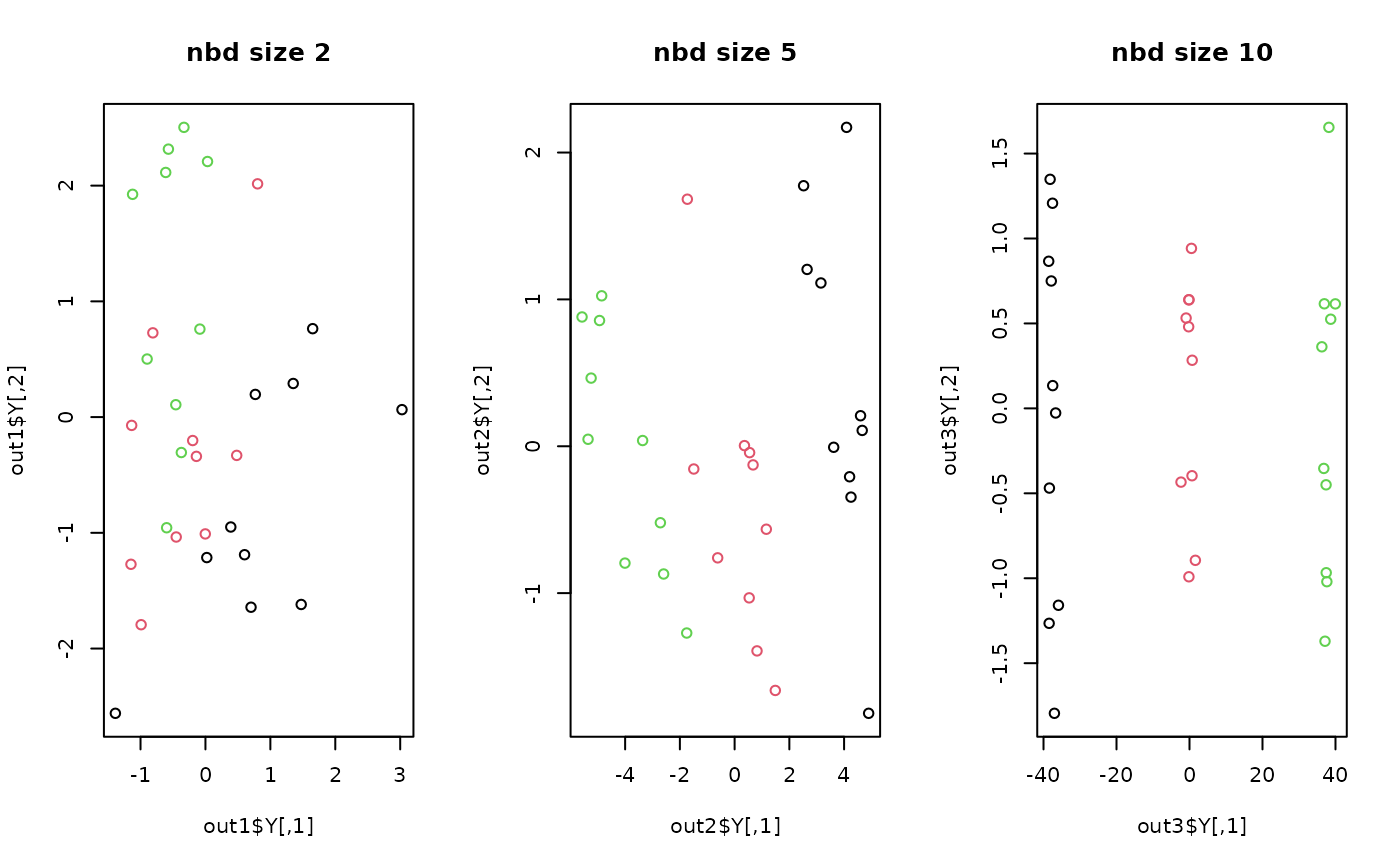
## try different affinity matrices
out1 = do.lsda(X, label, k1=2, k2=2)
out2 = do.lsda(X, label, k1=5, k2=5)
out3 = do.lsda(X, label, k1=10, k2=10)
## visualize
opar <- par(no.readonly=TRUE)
par(mfrow=c(1,3))
plot(out1$Y, col=label, main="nbd size 2")
plot(out2$Y, col=label, main="nbd size 5")
plot(out3$Y, col=label, main="nbd size 10")
 par(opar)