Locality Sensitive Discriminant Feature (LSDF) is a semi-supervised feature selection method. It utilizes both labeled and unlabeled data points in that labeled points are used to maximize the margin between data opints from different classes, while labeled ones are used to discover the geometrical structure of the data space.
Arguments
- X
an \((n\times p)\) matrix or data frame whose rows are observations and columns represent independent variables.
- label
a length-\(n\) vector of data class labels. It should contain
NAelements for missing label.- ndim
an integer-valued target dimension.
- type
a vector of neighborhood graph construction. Following types are supported;
c("knn",k),c("enn",radius), andc("proportion",ratio). Default isc("proportion",0.1), connecting about 1/10 of nearest data points among all data points. See alsoaux.graphnbdfor more details.- preprocess
an additional option for preprocessing the data. Default is "null". See also
aux.preprocessfor more details.- gamma
within-class weight parameter for same-class data.
Value
a named list containing
- Y
an \((n\times ndim)\) matrix whose rows are embedded observations.
- featidx
a length-\(ndim\) vector of indices with highest scores.
- trfinfo
a list containing information for out-of-sample prediction.
- projection
a \((p\times ndim)\) whose columns are basis for projection.
References
Cai D, He X, Zhou K, Han J, Bao H (2007). “Locality Sensitive Discriminant Analysis.” In Proceedings of the 20th International Joint Conference on Artifical Intelligence, IJCAI'07, 708--713.
Examples
## generate data of 3 types with clear difference
set.seed(100)
dt1 = aux.gensamples(n=20)-50
dt2 = aux.gensamples(n=20)
dt3 = aux.gensamples(n=20)+50
## merge the data and create a label correspondingly
X = rbind(dt1,dt2,dt3)
label = rep(1:3, each=20)
## copy a label and let 20% of elements be missing
nlabel = length(label)
nmissing = round(nlabel*0.20)
label_missing = label
label_missing[sample(1:nlabel, nmissing)]=NA
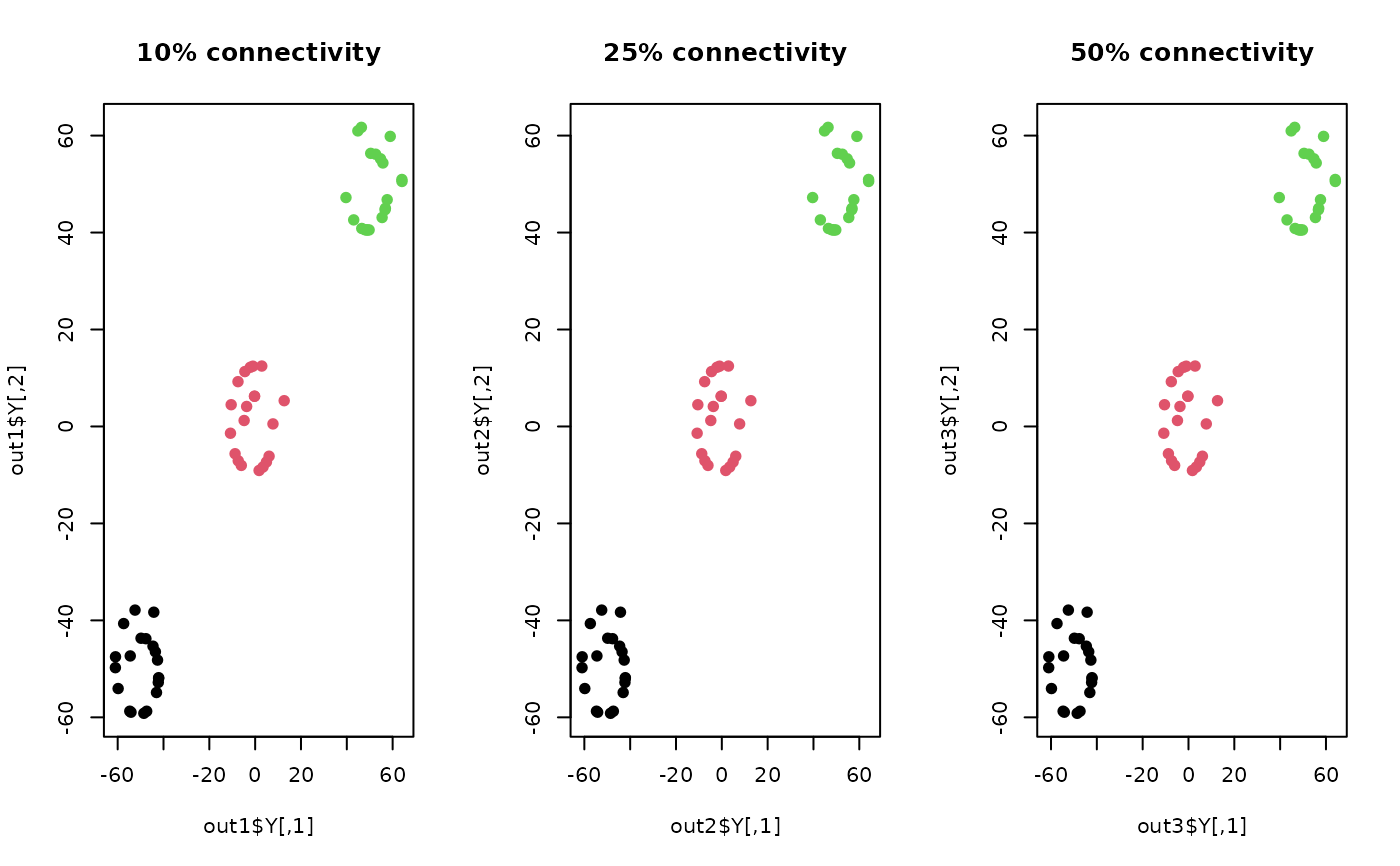
## try different neighborhood sizes
out1 = do.lsdf(X, label_missing, type=c("proportion",0.10))
out2 = do.lsdf(X, label_missing, type=c("proportion",0.25))
out3 = do.lsdf(X, label_missing, type=c("proportion",0.50))
## visualize
opar <- par(no.readonly=TRUE)
par(mfrow=c(1,3))
plot(out1$Y, pch=19, col=label, main="10% connectivity")
plot(out2$Y, pch=19, col=label, main="25% connectivity")
plot(out3$Y, pch=19, col=label, main="50% connectivity")
 par(opar)