Fisher Score (Fisher 1936) is a supervised linear feature extraction method. For each feature/variable, it computes Fisher score, a ratio of between-class variance to within-class variance. The algorithm selects variables with largest Fisher scores and returns an indicator projection matrix.
do.fscore(X, label, ndim = 2, ...)Arguments
- X
an \((n\times p)\) matrix or data frame whose rows are observations and columns represent independent variables.
- label
a length-\(n\) vector of data class labels.
- ndim
an integer-valued target dimension.
- ...
extra parameters including
- preprocess
an additional option for preprocessing the data. Default is
"null". See alsoaux.preprocessfor more details.
Value
a named Rdimtools S3 object containing
- Y
an \((n\times ndim)\) matrix whose rows are embedded observations.
- featidx
a length-\(ndim\) vector of indices with highest scores.
- projection
a \((p\times ndim)\) whose columns are basis for projection.
- trfinfo
a list containing information for out-of-sample prediction.
- algorithm
name of the algorithm.
References
Fisher RA (1936). “THE USE OF MULTIPLE MEASUREMENTS IN TAXONOMIC PROBLEMS.” Annals of Eugenics, 7(2), 179–188.
Examples
# \donttest{
## use iris data
## it is known that feature 3 and 4 are more important.
data(iris)
set.seed(100)
subid = sample(1:150,50)
iris.dat = as.matrix(iris[subid,1:4])
iris.lab = as.factor(iris[subid,5])
## compare Fisher score with LDA
out1 = do.lda(iris.dat, iris.lab)
out2 = do.fscore(iris.dat, iris.lab)
## visualize
opar <- par(no.readonly=TRUE)
par(mfrow=c(1,2))
plot(out1$Y, pch=19, col=iris.lab, main="LDA")
plot(out2$Y, pch=19, col=iris.lab, main="Fisher Score")
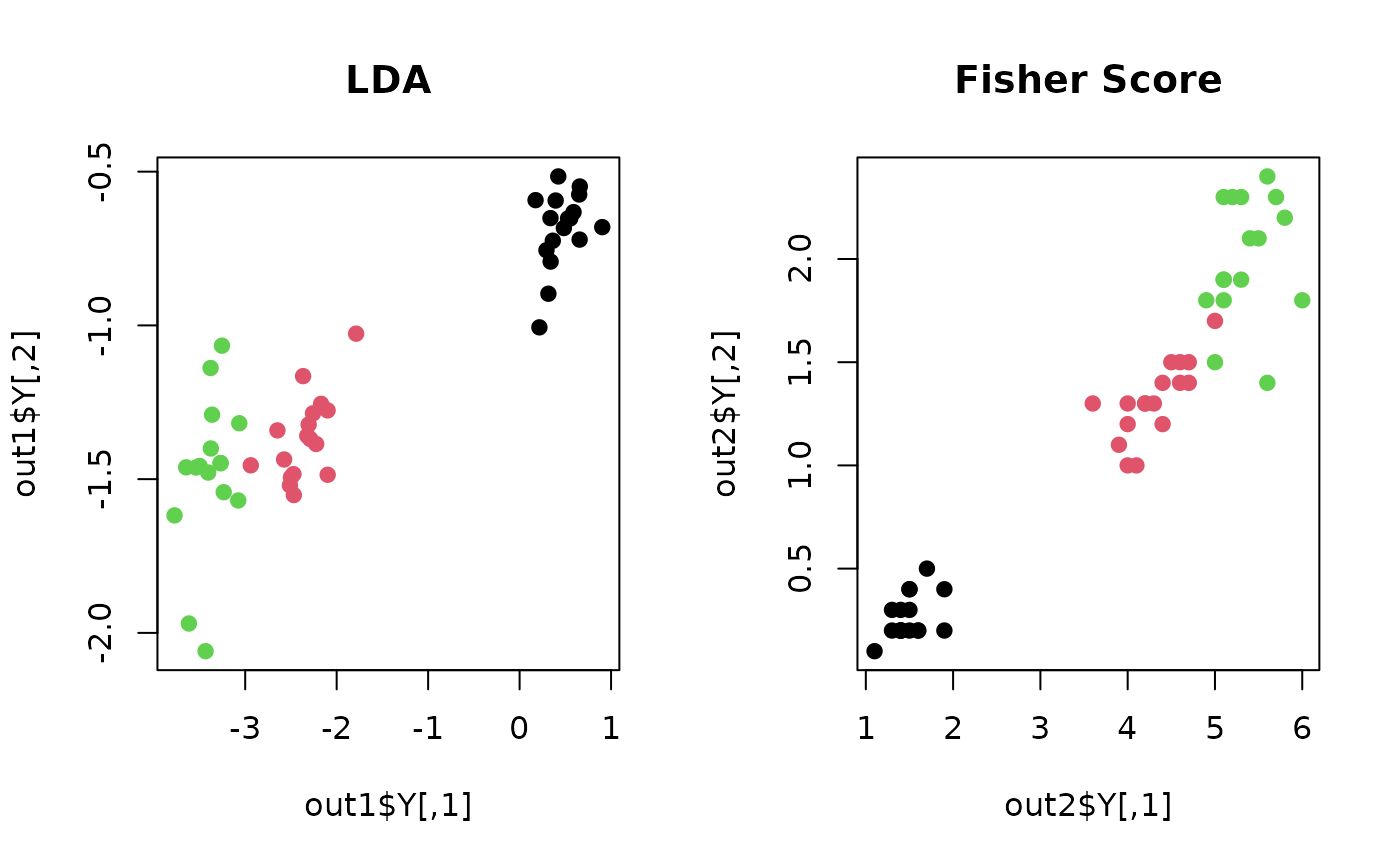 par(opar)
# }
par(opar)
# }