Forward Orthogonal Search by Maximizing the Overall Dependency
Source:R/v1_feature_FOSMOD.R
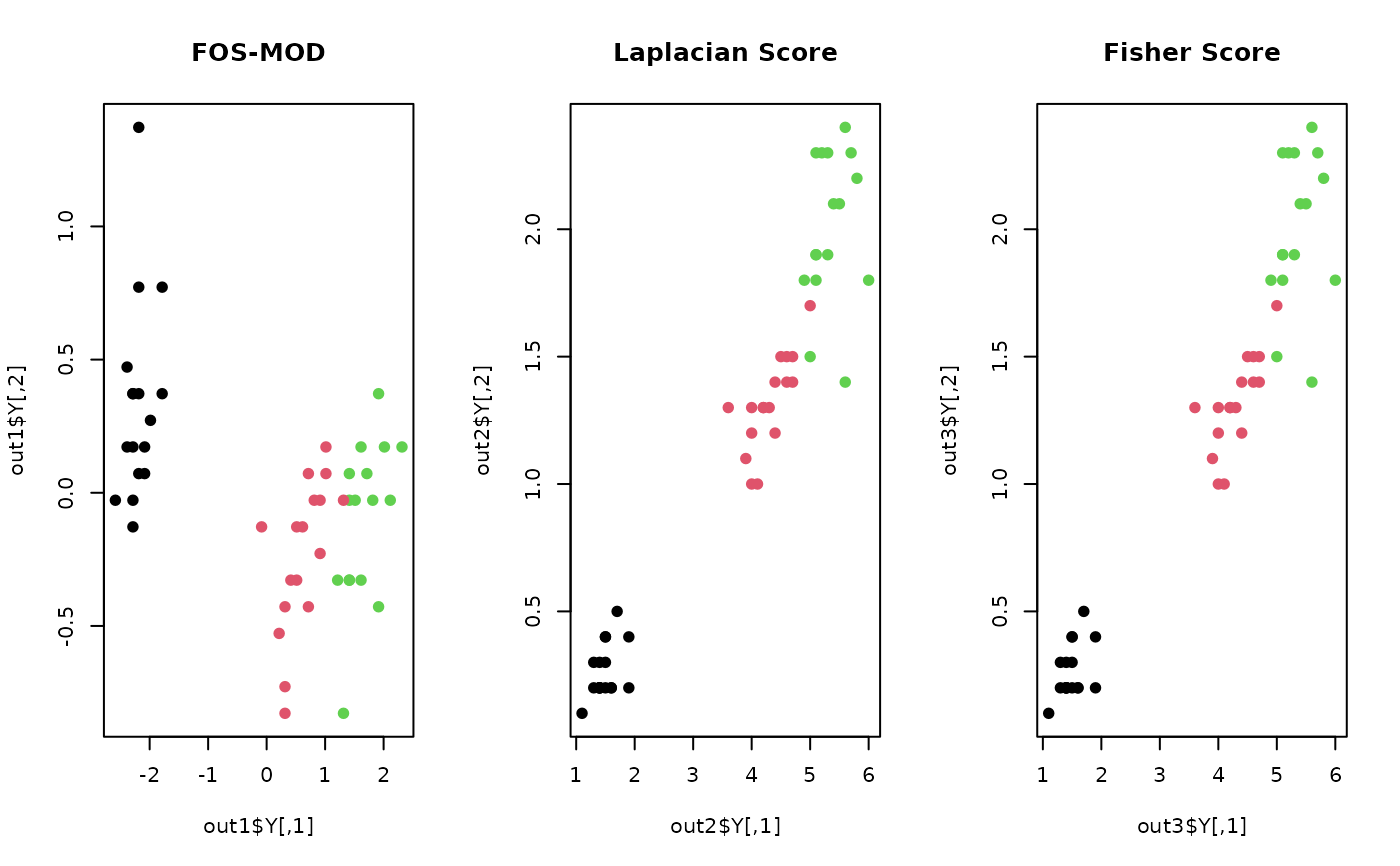
feature_FOSMOD.RdThe FOS-MOD algorithm (Wei and Billings 2007) is an unsupervised algorithm that selects a desired number of features in a forward manner by ranking the features using the squared correlation coefficient and sequential orthogonalization.
do.fosmod(X, ndim = 2, ...)Arguments
- X
an \((n\times p)\) matrix or data frame whose rows are observations and columns represent independent variables.
- ndim
an integer-valued target dimension (default: 2).
- ...
extra parameters including
- preprocess
an additional option for preprocessing the data. See also
aux.preprocessfor more details (default:"center").
Value
a named Rdimtools S3 object containing
- Y
an \((n\times ndim)\) matrix whose rows are embedded observations.
- featidx
a length-\(ndim\) vector of indices with highest scores.
- projection
a \((p\times ndim)\) whose columns are basis for projection.
- trfinfo
a list containing information for out-of-sample prediction.
- algorithm
name of the algorithm.
References
Wei H, Billings S (2007). “Feature Subset Selection and Ranking for Data Dimensionality Reduction.” IEEE Transactions on Pattern Analysis and Machine Intelligence, 29(1), 162–166. ISSN 0162-8828.
Examples
# \donttest{
## use iris data
## it is known that feature 3 and 4 are more important.
data(iris)
set.seed(100)
subid    <- sample(1:150, 50)
iris.dat <- as.matrix(iris[subid,1:4])
iris.lab <- as.factor(iris[subid,5])

## compare with other methods
out1 = do.fosmod(iris.dat)
out2 = do.lscore(iris.dat)
out3 = do.fscore(iris.dat, iris.lab)

## visualize
opar <- par(no.readonly=TRUE)
par(mfrow=c(1,3))
plot(out1$Y, pch=19, col=iris.lab, main="FOS-MOD")
plot(out2$Y, pch=19, col=iris.lab, main="Laplacian Score")
plot(out3$Y, pch=19, col=iris.lab, main="Fisher Score")

par(opar)
# }
par(opar)
# }