Diversity-Induced Self-Representation (DISR) is a feature selection method that aims at
ranking features by both representativeness and diversity. Self-representation controlled by
lbd1 lets the most representative features to be selected, while lbd2 penalizes
the degree of inter-feature similarity to enhance diversity from the chosen features.
do.disr(
  X,
  ndim = 2,
  preprocess = c("null", "center", "scale", "cscale", "whiten", "decorrelate"),
  lbd1 = 1,
  lbd2 = 1
)
Arguments
- X
an \((n\times p)\) matrix or data frame whose rows are observations and columns represent independent variables.
- ndim
an integer-valued target dimension.
- preprocess
an additional option for preprocessing the data. Default is "null". See also
aux.preprocessfor more details.- lbd1
nonnegative number to control the degree of regularization of the self-representation.
- lbd2
nonnegative number to control the degree of feature diversity.
lbd2=1gives equal weight to self-representation and diversity.
Value
a named list containing
- Y
an \((n\times ndim)\) matrix whose rows are embedded observations.
- featidx
a length-\(ndim\) vector of indices with highest scores.
- trfinfo
a list containing information for out-of-sample prediction.
- projection
a \((p\times ndim)\) whose columns are basis for projection.
References
Liu Y, Liu K, Zhang C, Wang J, Wang X (2017). “Unsupervised Feature Selection via Diversity-Induced Self-Representation.” Neurocomputing, 219, 350--363.
See also
Examples
# \donttest{
## use iris data
data(iris)
set.seed(100)
subid = sample(1:150, 50)
X = as.matrix(iris[subid,1:4])
label = as.factor(iris[subid,5])
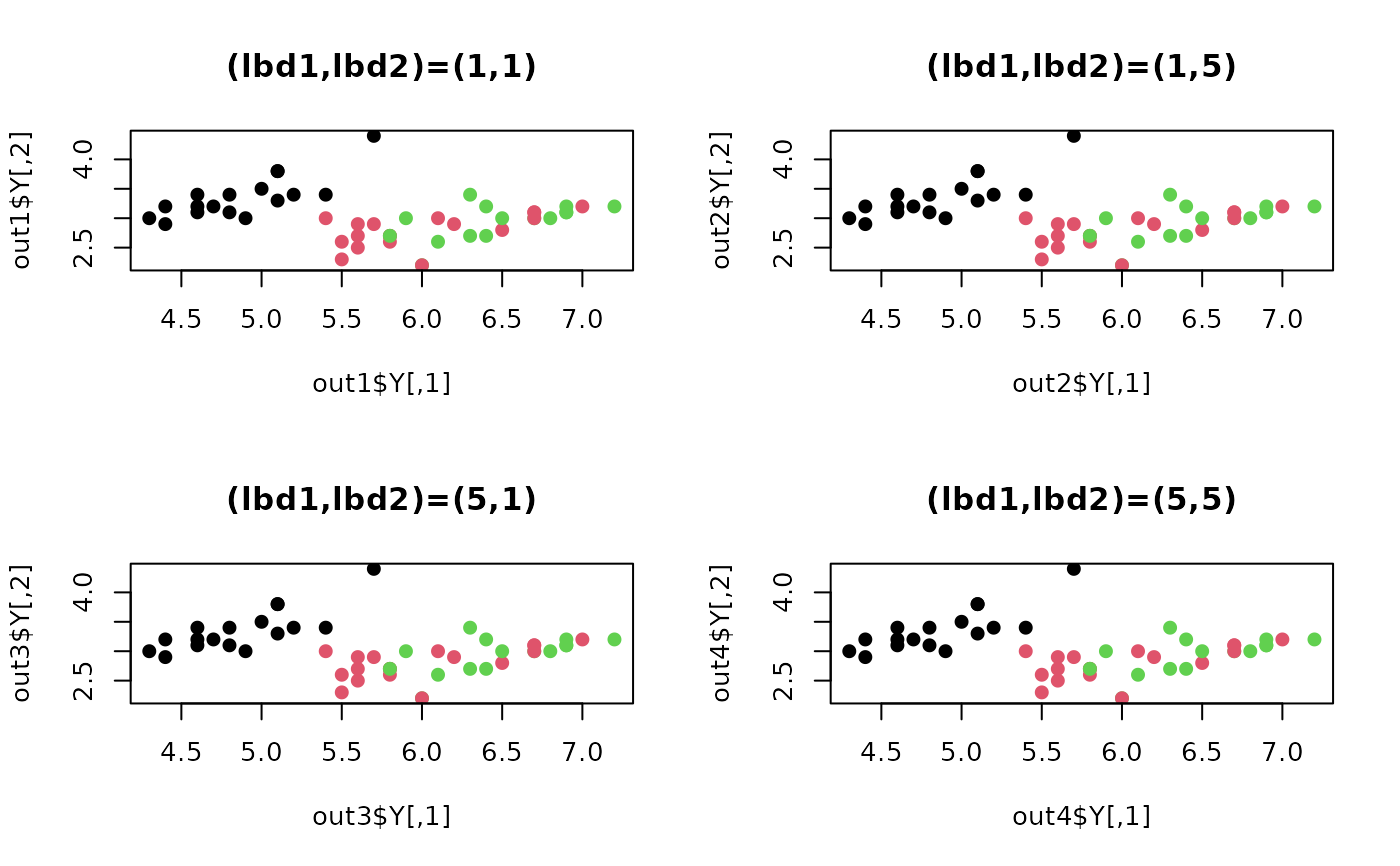
#### try different lbd combinations
out1 = do.disr(X, lbd1=1, lbd2=1)
out2 = do.disr(X, lbd1=1, lbd2=5)
out3 = do.disr(X, lbd1=5, lbd2=1)
out4 = do.disr(X, lbd1=5, lbd2=5)
## visualize
opar <- par(no.readonly=TRUE)
par(mfrow=c(2,2))
plot(out1$Y, main="(lbd1,lbd2)=(1,1)", col=label, pch=19)
plot(out2$Y, main="(lbd1,lbd2)=(1,5)", col=label, pch=19)
plot(out3$Y, main="(lbd1,lbd2)=(5,1)", col=label, pch=19)
plot(out4$Y, main="(lbd1,lbd2)=(5,5)", col=label, pch=19)
 par(opar)
# }
par(opar)
# }