Given a data matrix \(X\) where observations are stacked in a row-wise manner, Regularized Self-Representation (RSR) aims at finding a solution to following optimization problem $$\textrm{min}~ \|X-XW\|_{2,1} + \lambda \| W \|_{2,1}$$ where \(\|W\|_{2,1} = \sum_{i=1}^{m} \|W_{i:} \|_2\) is an \(\ell_{2,1}\) norm that imposes row-wise sparsity constraint.
do.rsr(X, ndim = 2, lbd = 1)Arguments
- X
an \((n\times p)\) matrix or data frame whose rows are observations and columns represent independent variables.
- ndim
an integer-valued target dimension.
- lbd
nonnegative number to control the degree of self-representation by imposing row-sparsity.
Value
a named Rdimtools S3 object containing
- Y
an \((n\times ndim)\) matrix whose rows are embedded observations.
- featidx
a length-\(ndim\) vector of indices with highest scores.
- projection
a \((p\times ndim)\) whose columns are basis for projection.
- algorithm
name of the algorithm.
References
Zhu P, Zuo W, Zhang L, Hu Q, Shiu SC (2015). “Unsupervised Feature Selection by Regularized Self-Representation.” Pattern Recognition, 48(2), 438--446.
Examples
# \donttest{
## load iris data
data(iris)
set.seed(100)
subid = sample(1:150,50)
X = as.matrix(iris[subid,1:4])
label = as.factor(iris[subid,5])
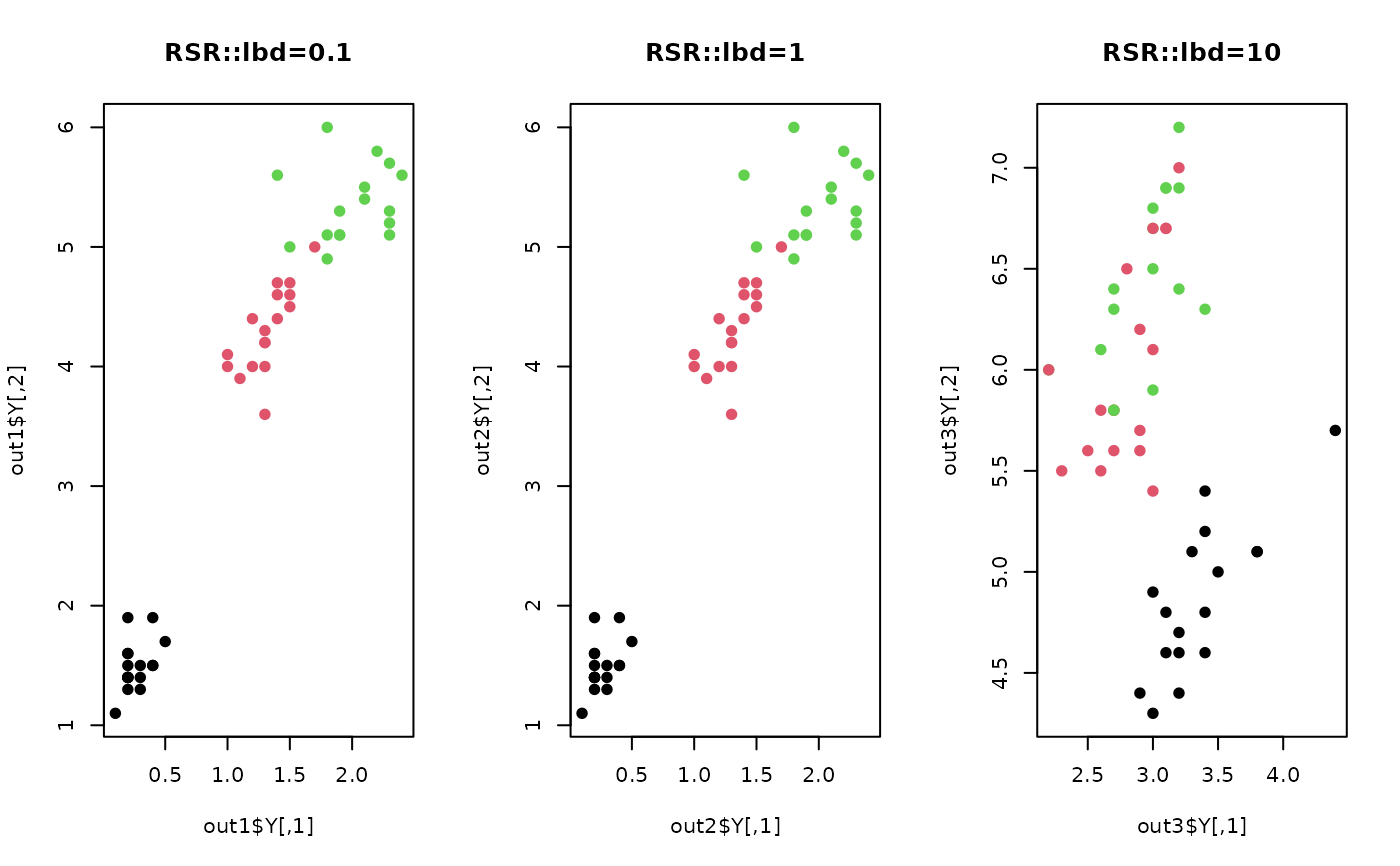
#### try different lbd combinations
out1 = do.rsr(X, lbd=0.1)
out2 = do.rsr(X, lbd=1)
out3 = do.rsr(X, lbd=10)
#### visualize
opar <- par(no.readonly=TRUE)
par(mfrow=c(1,3))
plot(out1$Y, pch=19, col=label, main="RSR::lbd=0.1")
plot(out2$Y, pch=19, col=label, main="RSR::lbd=1")
plot(out3$Y, pch=19, col=label, main="RSR::lbd=10")
 par(opar)
# }
par(opar)
# }