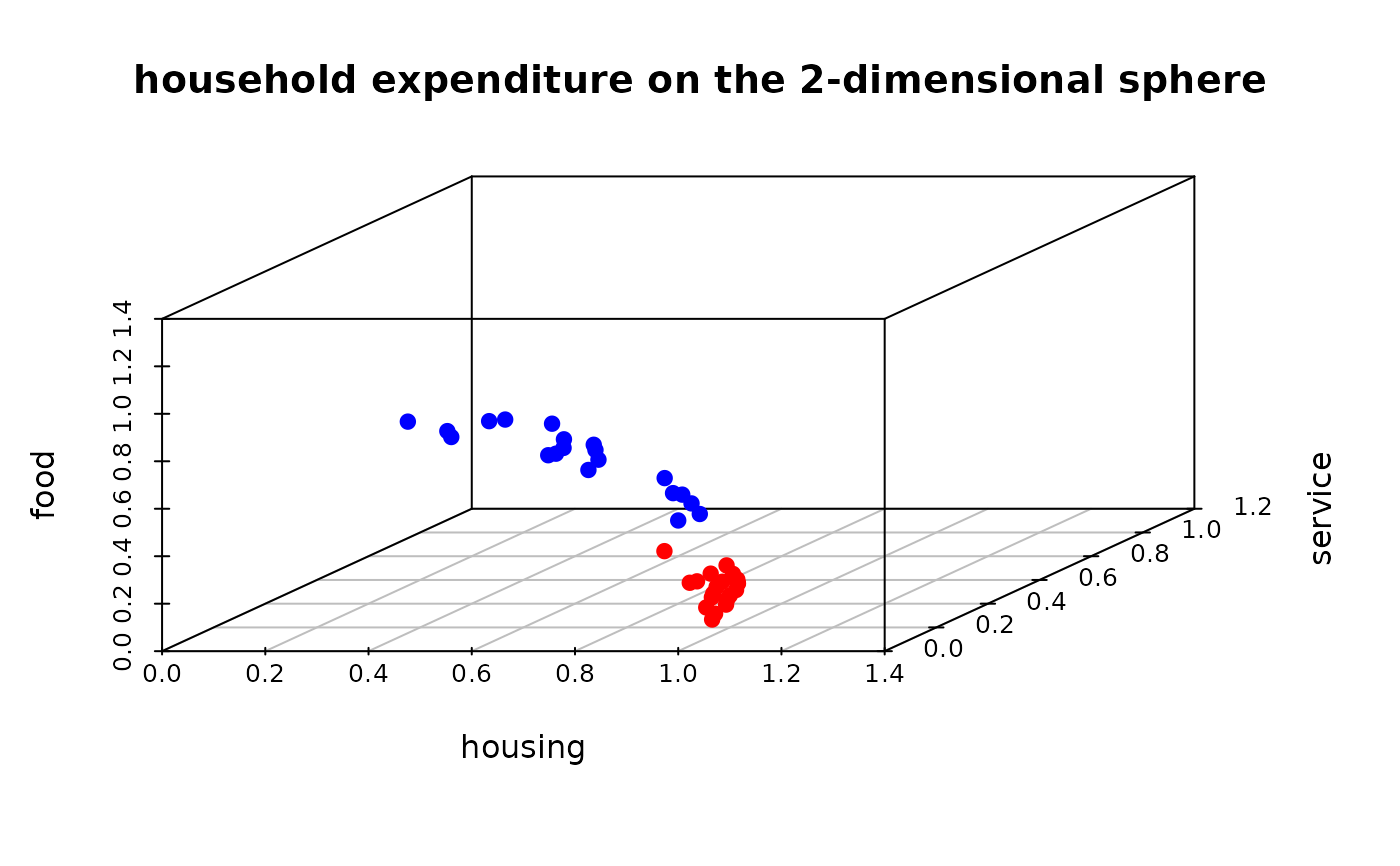
The data is taken from HSAUR3 package's household data. We use
housing, service, and food variables and normalize them to be unit-norm so
that each observation is projected onto the 2-dimensional sphere. The data
consists of 20 males and 20 females and has been used for clustering
on the unit hypersphere.
data(household)
Format
a named list containing
- data
an \((n\times 3)\) data matrix whose rows are unit-norm.
- gender
a length-\(n\) factor for class label.
See also
Examples
# \donttest{ ## Load the data data(household, package="T4cluster") ## Visualize the data in pairs opar <- par(no.readonly=TRUE) scatterplot3d::scatterplot3d(household$data, color=rep(c("red","blue"), each=20), pch=19, main="household expenditure on the 2-dimensional sphere", xlim=c(0,1.2), ylim=c(0,1.2), zlim=c(0,1.2), angle=45)