When the data lies in a high-dimensional Euclidean space, fitting a model-based clustering algorithm is troublesome. This function implements an algorithm from the reference, which uses an aggregate information from an ensemble of Gaussian mixtures in combination with random projection.
gmm03F(data, k = 2, ...)
Arguments
| data | an \((n\times p)\) matrix of row-stacked observations. |
|---|---|
| k | the number of clusters (default: 2). |
| ... | extra parameters including
|
Value
a named list of S3 class T4cluster containing
- cluster
a length-\(n\) vector of class labels (from \(1:k\)).
- algorithm
name of the algorithm.
References
Fern XZ, Brodley CE (2003). “Random Projection for High Dimensional Data Clustering: A Cluster Ensemble Approach.” In Proceedings of the Twentieth International Conference on International Conference on Machine Learning, ICML'03, 186–193. ISBN 1577351894.
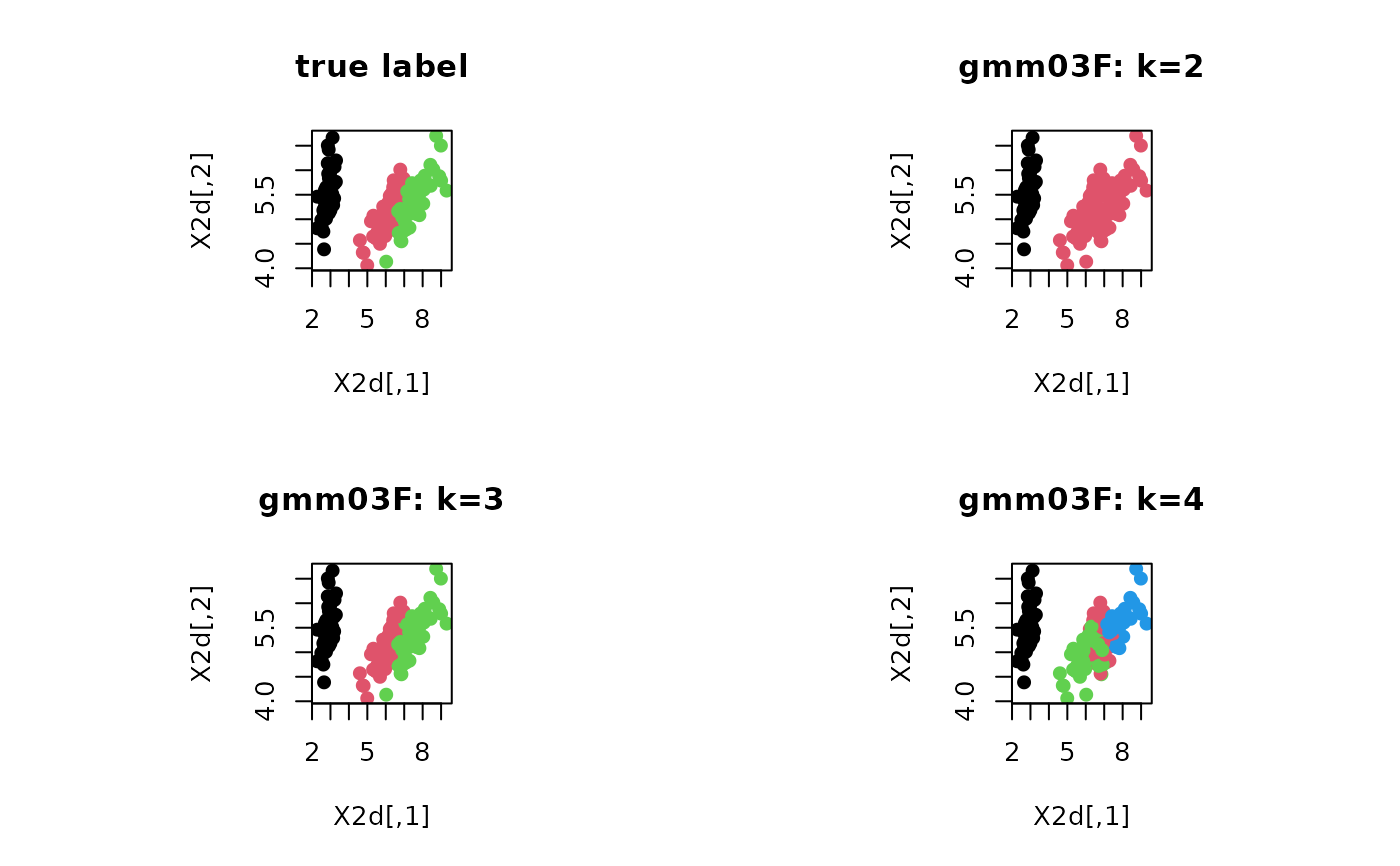
Examples
# \donttest{ # ------------------------------------------------------------- # clustering with 'iris' dataset # ------------------------------------------------------------- ## PREPARE data(iris) X = as.matrix(iris[,1:4]) lab = as.integer(as.factor(iris[,5])) ## EMBEDDING WITH PCA X2d = Rdimtools::do.pca(X, ndim=2)$Y ## CLUSTERING WITH DIFFERENT K VALUES cl2 = gmm03F(X, k=2)$cluster cl3 = gmm03F(X, k=3)$cluster cl4 = gmm03F(X, k=4)$cluster ## VISUALIZATION opar <- par(no.readonly=TRUE) par(mfrow=c(2,2), pty="s") plot(X2d, col=lab, pch=19, main="true label") plot(X2d, col=cl2, pch=19, main="gmm03F: k=2") plot(X2d, col=cl3, pch=19, main="gmm03F: k=3") plot(X2d, col=cl4, pch=19, main="gmm03F: k=4")