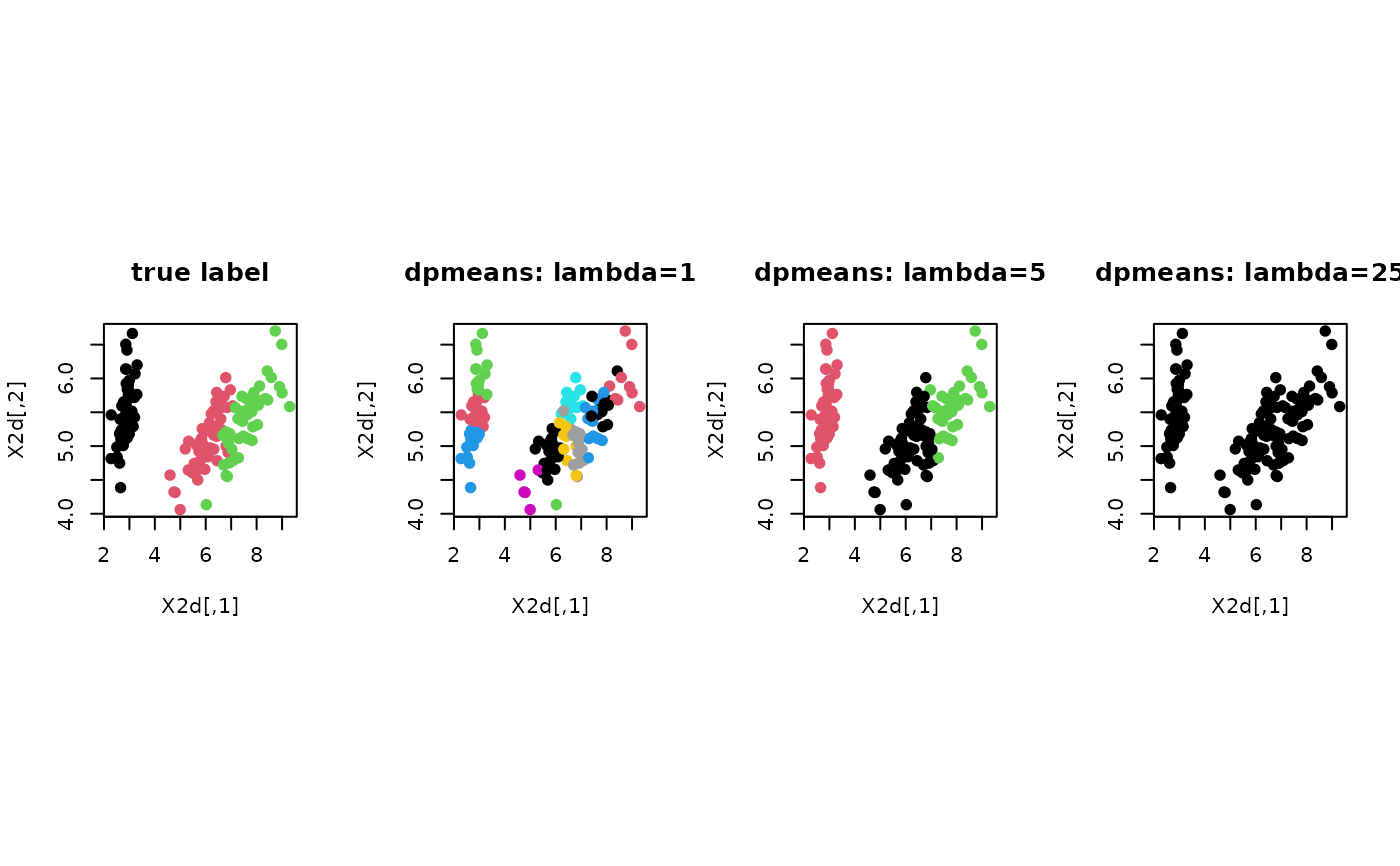
DP-means is a non-parametric clustering method motivated by DP mixture model in that the number of clusters is determined by a parameter \(\lambda\). The larger the \(\lambda\) value is, the smaller the number of clusters is attained. In addition to the original paper, we added an option to randomly permute an order of updating for each observation's membership as a common heuristic in the literature of cluster analysis.
dpmeans(data, lambda = 0.1, ...)
Arguments
| data | an \((n\times p)\) matrix of row-stacked observations. |
|---|---|
| lambda | a threshold to define a new cluster (default: 0.1). |
| ... | extra parameters including
|
Value
a named list of S3 class T4cluster containing
- cluster
a length-\(n\) vector of class labels (from \(1:k\)).
- algorithm
name of the algorithm.
References
Kulis B, Jordan MI (2012). “Revisiting K-Means: New Algorithms via Bayesian Nonparametrics.” In Proceedings of the 29th International Coference on International Conference on Machine Learning, ICML'12, 1131--1138. ISBN 978-1-4503-1285-1.
Examples
# ------------------------------------------------------------- # clustering with 'iris' dataset # ------------------------------------------------------------- ## PREPARE data(iris) X = as.matrix(iris[,1:4]) lab = as.integer(as.factor(iris[,5])) ## EMBEDDING WITH PCA X2d = Rdimtools::do.pca(X, ndim=2)$Y ## CLUSTERING WITH DIFFERENT LAMBDA VALUES dpm1 = dpmeans(X, lambda=1)$cluster dpm2 = dpmeans(X, lambda=5)$cluster dpm3 = dpmeans(X, lambda=25)$cluster ## VISUALIZATION opar <- par(no.readonly=TRUE) par(mfrow=c(1,4), pty="s") plot(X2d, col=lab, pch=19, main="true label") plot(X2d, col=dpm1, pch=19, main="dpmeans: lambda=1") plot(X2d, col=dpm2, pch=19, main="dpmeans: lambda=5") plot(X2d, col=dpm3, pch=19, main="dpmeans: lambda=25")