Robust Euclidean Embedding (REE) is an embedding procedure exploiting robustness of \(\ell_1\) cost function. In our implementation, we adopted a generalized version with weight matrix to be applied as well. Its original paper introduced a subgradient algorithm to overcome memory-intensive nature of original semidefinite programming formulation.
Arguments
- X
an \((n\times p)\) matrix or data frame whose rows are observations and columns represent independent variables.
- ndim
an integer-valued target dimension.
- W
an \((n\times n)\) weight matrix. Default is uniform weight of 1s.
- preprocess
an additional option for preprocessing the data. Default is "null". See also
aux.preprocessfor more details.- initc
initial
cvalue for subgradient iterating stepsize, \(c/\sqrt{i}\).- dmethod
a type of distance measure. See
distfor more details.- maxiter
maximum number of iterations for subgradient descent method.
- abstol
stopping criterion for subgradient descent method.
Value
a named list containing
- Y
an \((n\times ndim)\) matrix whose rows are embedded observations.
- niter
the number of iterations taken til convergence.
- trfinfo
a list containing information for out-of-sample prediction.
References
Cayton L, Dasgupta S (2006). “Robust Euclidean Embedding.” In Proceedings of the 23rd International Conference on Machine Learning, ICML '06, 169--176.
Examples
# \donttest{
## use iris data
data(iris)
set.seed(100)
subid = sample(1:150,50)
X     = as.matrix(iris[subid,1:4])
label = as.factor(iris[subid,5])

## try different distance method
output1 <- do.ree(X, maxiter=50, dmethod="euclidean")
output2 <- do.ree(X, maxiter=50, dmethod="maximum")
output3 <- do.ree(X, maxiter=50, dmethod="canberra")

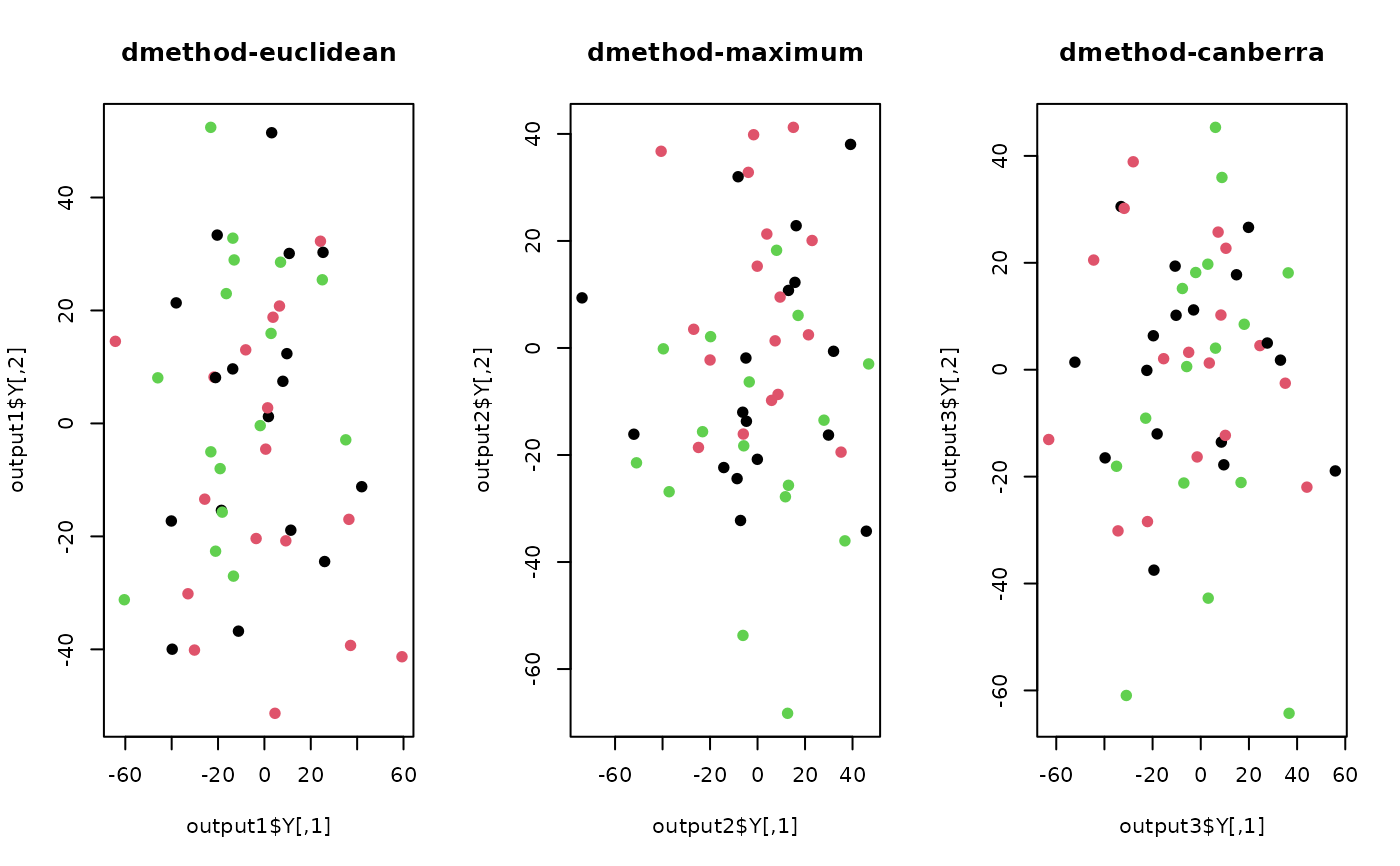
## visualize three different projections
opar <- par(no.readonly=TRUE)
par(mfrow=c(1,3))
plot(output1$Y, col=label, pch=19, main="dmethod-euclidean")
plot(output2$Y, col=label, pch=19, main="dmethod-maximum")
plot(output3$Y, col=label, pch=19, main="dmethod-canberra")

par(opar)
# }