Potential of Heat Diffusion for Affinity-based Transition Embedding
Source:R/nonlinear_PHATE.R
nonlinear_PHATE.RdPHATE is a nonlinear method that is specifically targeted at visualizing high-dimensional data by embedding it on 2- or 3-dimensional space. We offer a native implementation of PHATE solely in R/C++ without interface to python module.
do.phate(
  X,
  ndim = 2,
  k = 5,
  alpha = 10,
  dtype = c("sqrt", "log"),
  smacof = TRUE,
  ...
)
Arguments
- X
an \((n\times p)\) matrix or data frame whose rows are observations and columns represent independent variables.
- ndim
an integer-valued target dimension (default: 2).
- k
size of nearest neighborhood (default: 5).
- alpha
decay parameter for Gaussian kernel exponent (default: 10).
- dtype
type of potential distance transformation;
"log"or"sqrt"(default:"sqrt").- smacof
a logical;
TRUEto use SMACOF for Metric MDS orFALSEto use Classical MDS (default:TRUE).- ...
extra parameters including
- maxiter
maximum number of iterations (default: 100).
- abstol
absolute stopping criterion for metric MDS iterations (default: 1e-8).
Value
a named Rdimtools S3 object containing
- Y
an \((n\times ndim)\) matrix whose rows are embedded observations.
- algorithm
name of the algorithm.
References
Moon KR, van Dijk D, Wang Z, Gigante S, Burkhardt DB, Chen WS, Yim K, van den Elzen A, Hirn MJ, Coifman RR, Ivanova NB, Wolf G, Krishnaswamy S (2019). “Visualizing Structure and Transitions in High-Dimensional Biological Data.” Nature Biotechnology, 37(12), 1482–1492. ISSN 1087-0156, 1546-1696.
Examples
# \donttest{
## load iris data
data(iris)
X = as.matrix(iris[,1:4])
lab = as.factor(iris[,5])
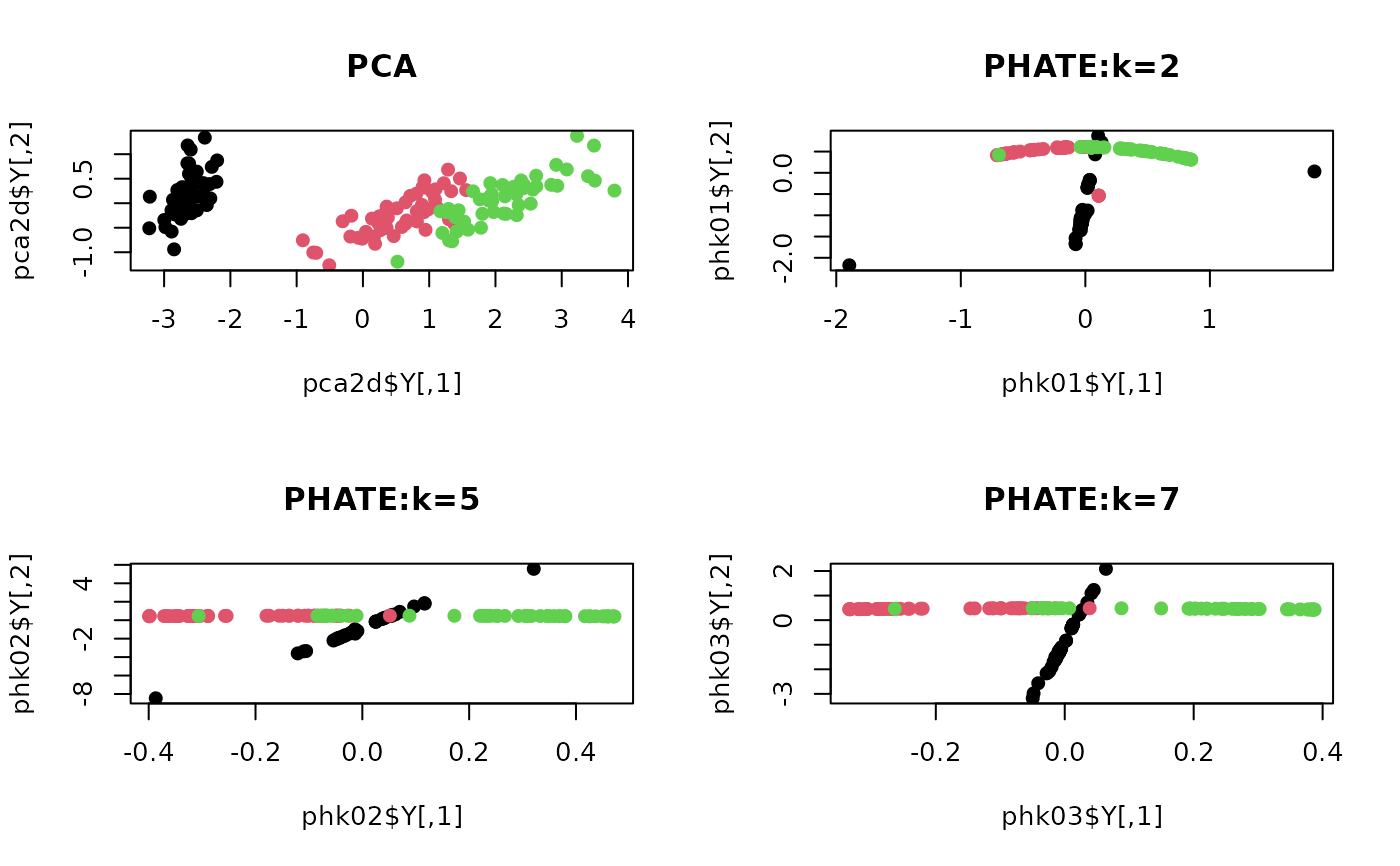
## compare different neighborhood sizes.
pca2d <- do.pca(X, ndim=2)
phk01 <- do.phate(X, ndim=2, k=2)
phk02 <- do.phate(X, ndim=2, k=5)
phk03 <- do.phate(X, ndim=2, k=7)
## Visualize
opar <- par(no.readonly=TRUE)
par(mfrow=c(2,2))
plot(pca2d$Y, col=lab, pch=19, main="PCA")
plot(phk01$Y, col=lab, pch=19, main="PHATE:k=2")
plot(phk02$Y, col=lab, pch=19, main="PHATE:k=5")
plot(phk03$Y, col=lab, pch=19, main="PHATE:k=7")
 par(opar)
# }
par(opar)
# }