Maximum Scatter Difference (MSD) is a supervised linear dimension reduction method. The basic idea of MSD is to use additive cost function rather than multiplicative trace ratio criterion that was adopted by LDA. Due to such formulation, it can neglect sample-sample-size problem from rank-deficiency of between-class variance matrix.
do.msd(
  X,
  label,
  ndim = 2,
  preprocess = c("center", "scale", "cscale", "whiten", "decorrelate"),
  C = 1
)
Arguments
- X
an \((n\times p)\) matrix or data frame whose rows are observations and columns represent independent variables.
- label
a length-\(n\) vector of data class labels.
- ndim
an integer-valued target dimension.
- preprocess
an additional option for preprocessing the data. Default is "center". See also
aux.preprocessfor more details.- C
nonnegative balancing parameter for intra- and inter-class variance.
Value
a named list containing
- Y
an \((n\times ndim)\) matrix whose rows are embedded observations.
- trfinfo
a list containing information for out-of-sample prediction.
- projection
a \((p\times ndim)\) whose columns are basis for projection.
References
Song F, Zhang D, Chen Q, Wang J (2007). “Face Recognition Based on a Novel Linear Discriminant Criterion.” Pattern Analysis and Applications, 10(3), 165--174.
Examples
## generate data of 3 types with clear difference
set.seed(100)
dt1 = aux.gensamples(n=20)-50
dt2 = aux.gensamples(n=20)
dt3 = aux.gensamples(n=20)+50
## merge the data and create a label correspondingly
X = rbind(dt1,dt2,dt3)
label = rep(1:3, each=20)
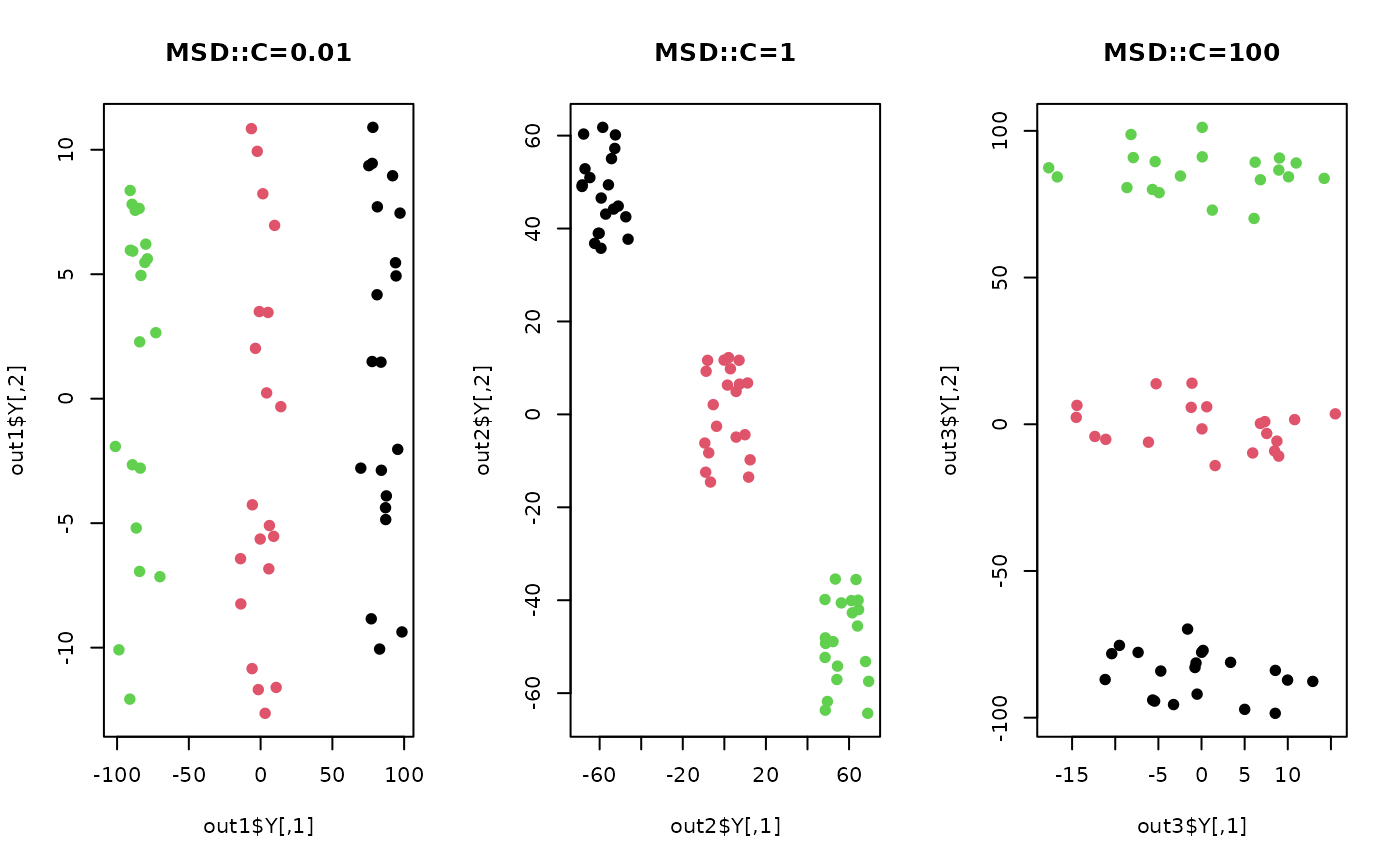
## try different balancing parameter
out1 = do.msd(X, label, C=0.01)
out2 = do.msd(X, label, C=1)
out3 = do.msd(X, label, C=100)
## visualize
opar <- par(no.readonly=TRUE)
par(mfrow=c(1,3))
plot(out1$Y, pch=19, col=label, main="MSD::C=0.01")
plot(out2$Y, pch=19, col=label, main="MSD::C=1")
plot(out3$Y, pch=19, col=label, main="MSD::C=100")
 par(opar)