Local Discriminant Embedding (LDE) is a supervised algorithm that learns the embedding for the submanifold of each class. Its idea is to same-class data points maintain their original neighborhood information while segregating different-class data distinct from each other.
Arguments
- X
an (n×p) matrix or data frame whose rows are observations.
- label
a length-n vector of data class labels.
- ndim
an integer-valued target dimension.
- t
kernel bandwidth in (0,∞).
- numk
the number of neighboring points for k-nn graph construction.
- preprocess
an additional option for preprocessing the data. Default is "center". See also
aux.preprocessfor more details.
Value
a named list containing
- Y
an (n×ndim) matrix whose rows are embedded observations.
- trfinfo
a list containing information for out-of-sample prediction.
- projection
a (p×ndim) whose columns are basis for projection.
References
Hwann-Tzong Chen, Huang-Wei Chang, Tyng-Luh Liu (2005). “Local Discriminant Embedding and Its Variants.” In 2005 IEEE Computer Society Conference on Computer Vision and Pattern Recognition, volume 2, 846--853.
Examples
## generate data of 2 types with clear difference
set.seed(100)
diff = 15
dt1 = aux.gensamples(n=50)-diff;
dt2 = aux.gensamples(n=50)+diff;
## merge the data and create a label correspondingly
X = rbind(dt1,dt2)
label = rep(1:2, each=50)
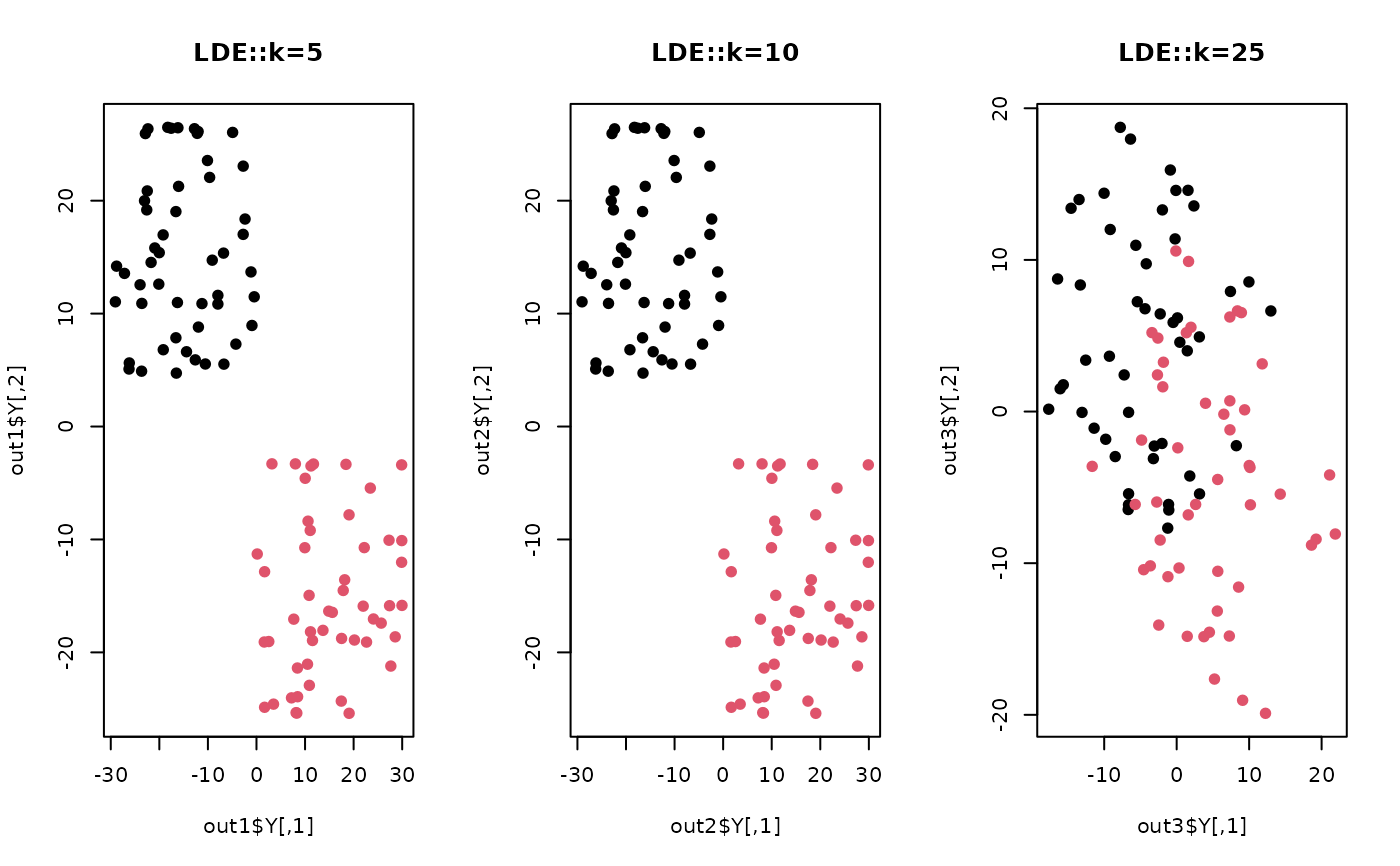
## try different neighborhood size
out1 <- do.lde(X, label, numk=5)
out2 <- do.lde(X, label, numk=10)
out3 <- do.lde(X, label, numk=25)
## visualize
opar <- par(no.readonly=TRUE)
par(mfrow=c(1,3))
plot(out1$Y, pch=19, col=label, main="LDE::k=5")
plot(out2$Y, pch=19, col=label, main="LDE::k=10")
plot(out3$Y, pch=19, col=label, main="LDE::k=25")
 par(opar)