do.ica is an R implementation of FastICA algorithm, which aims at
finding weight vectors that maximize a measure of non-Gaussianity of projected data.
FastICA is initiated with pre-whitening of the data. Single and multiple component
extraction are both supported. For more detailed information on ICA and FastICA algorithm,
see this Wikipedia page.
do.ica(
  X,
  ndim = 2,
  type = "logcosh",
  tpar = 1,
  sym = FALSE,
  tol = 1e-06,
  redundancy = TRUE,
  maxiter = 100
)
Arguments
- X
an \((n\times p)\) matrix or data frame whose rows are observations and columns represent independent variables.
- ndim
an integer-valued target dimension.
- type
nonquadratic function, one of
"logcosh","exp", or"poly"be chosen.- tpar
a numeric parameter for
logcoshandexpparameters that should be close to 1.- sym
a logical value;
FALSEfor not using symmetric decorrelation,TRUEotherwise.- tol
stopping criterion for iterative update.
- redundancy
a logical value;
TRUEfor removingNAvalues after prewhitening,FALSEotherwise.- maxiter
maximum number of iterations allowed.
- Y
an \((n\times ndim)\) matrix whose rows are embedded observations.
- trfinfo
a list containing information for out-of-sample prediction.
- projection
a \((p\times ndim)\) whose columns are basis for projection.
Details
In most of ICA literature, we have $$S = X*W$$ where \(W\) is an unmixing matrix for
the given data \(X\). In order to preserve consistency throughout our package, we changed
the notation; \(Y\) a projected matrix for \(S\), and projection for unmixing matrix \(W\).
References
Hyvarinen A, Karhunen J, Oja E (2001). Independent Component Analysis. J. Wiley, New York. ISBN 978-0-471-40540-5.
Examples
## use iris dataset
data(iris)
set.seed(100)
subid = sample(1:150,50)
X = as.matrix(iris[subid,1:4])
lab = as.factor(iris[subid,5])
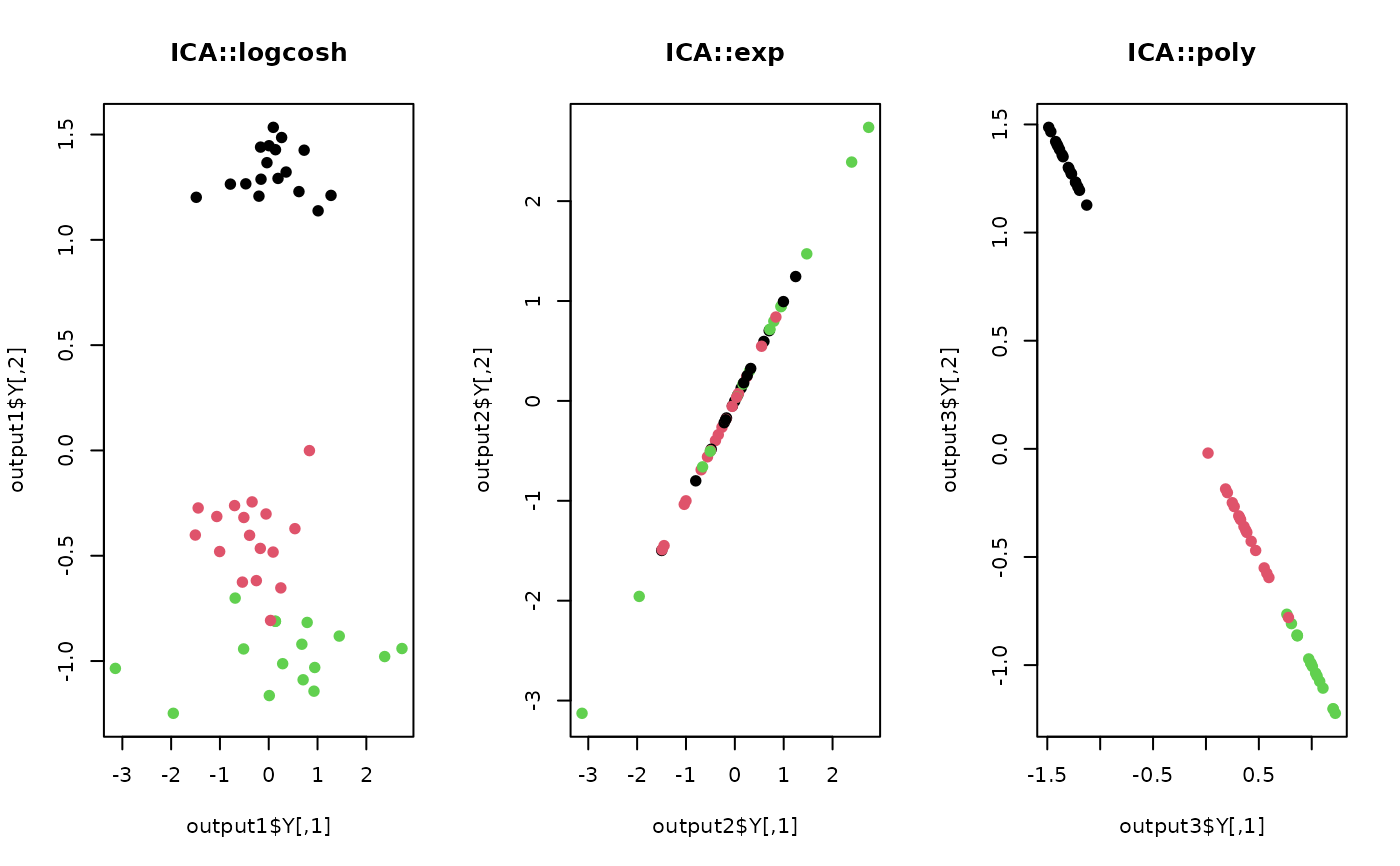
## 1. use logcosh function for transformation
output1 <- do.ica(X,ndim=2,type="logcosh")
## 2. use exponential function for transformation
output2 <- do.ica(X,ndim=2,type="exp")
## 3. use polynomial function for transformation
output3 <- do.ica(X,ndim=2,type="poly")
## Visualize three different projections
opar <- par(no.readonly=TRUE)
par(mfrow=c(1,3))
plot(output1$Y, col=lab, pch=19, main="ICA::logcosh")
plot(output2$Y, col=lab, pch=19, main="ICA::exp")
plot(output3$Y, col=lab, pch=19, main="ICA::poly")
 par(opar)