Double-Adjacency Graphs-based Discriminant Neighborhood Embedding
Source:R/linear_DAGDNE.R
linear_DAGDNE.RdDoublue Adjacency Graphs-based Discriminant Neighborhood Embedding (DAG-DNE) is a variant of DNE. As its name suggests, it introduces two adjacency graphs for homogeneous and heterogeneous samples accordaing to their labels.
Arguments
- X
an \((n\times p)\) matrix or data frame whose rows are observations.
- label
a length-\(n\) vector of data class labels.
- ndim
an integer-valued target dimension.
- numk
the number of neighboring points for k-nn graph construction.
- preprocess
an additional option for preprocessing the data. Default is "center". See also
aux.preprocessfor more details.
Value
a named list containing
- Y
an \((n\times ndim)\) matrix whose rows are embedded observations.
- trfinfo
a list containing information for out-of-sample prediction.
- projection
a \((p\times ndim)\) whose columns are basis for projection.
References
Ding C, Zhang L (2015). “Double Adjacency Graphs-Based Discriminant Neighborhood Embedding.” Pattern Recognition, 48(5), 1734–1742.
See also
Examples
## load iris data
data(iris)
set.seed(100)
subid = sample(1:150,50)
X = as.matrix(iris[subid,1:4])
label = as.factor(iris[subid,5])
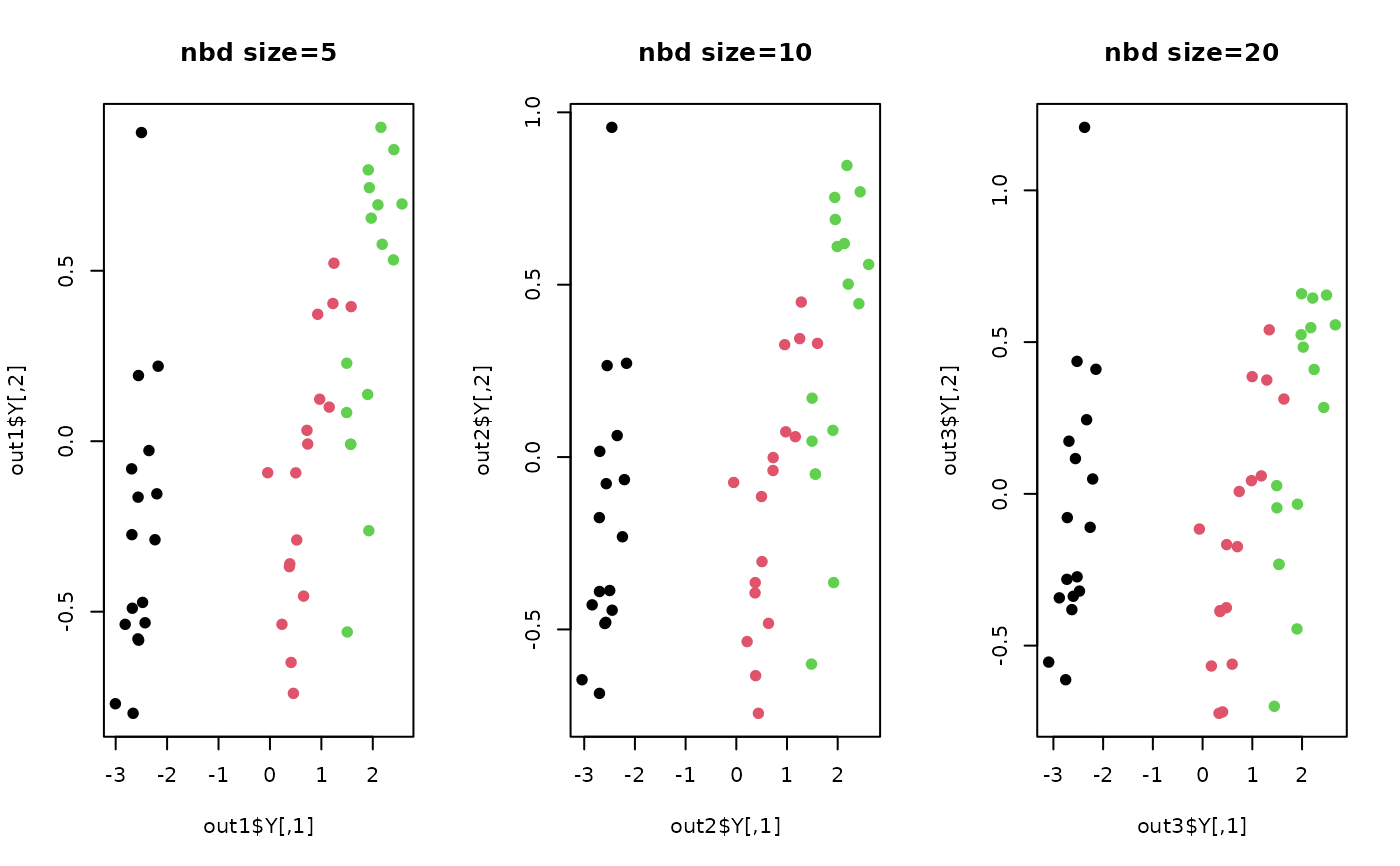
## try different numbers for neighborhood size
out1 = do.dagdne(X, label, numk=5)
out2 = do.dagdne(X, label, numk=10)
out3 = do.dagdne(X, label, numk=20)
## visualize
opar <- par(no.readonly=TRUE)
par(mfrow=c(1,3))
plot(out1$Y, main="nbd size=5", col=label, pch=19)
plot(out2$Y, main="nbd size=10",col=label, pch=19)
plot(out3$Y, main="nbd size=20",col=label, pch=19)
 par(opar)