Average Neighborhood Margin Maximization (ANMM) is a supervised method for feature extraction. It aims to find a projection mapping in the following manner; for each data point, the algorithm tries to pull the neighboring points in the same class while pushing neighboring points of different classes far away. It is known that ANMM does suffer less from small sample size problem, which is bottleneck for LDA.
Arguments
- X
an \((n\times p)\) matrix or data frame whose rows are observations and columns represent independent variables.
- label
a length-\(n\) vector of data class labels.
- ndim
an integer-valued target dimension.
- preprocess
an additional option for preprocessing the data. Default is "null". See also
aux.preprocessfor more details.- No
neighborhood size for same-class data points; either a constant number or a vector of length-\(n\) can be provided, as long as the values reside in \([2,n]\).
- Ne
neighborhood size for different-class data points; either a constant number or a vector of length-\(n\) can be provided, as long as the values reside in \([2,n]\).
Value
a named list containing
- Y
an \((n\times ndim)\) matrix whose rows are embedded observations.
- trfinfo
a list containing information for out-of-sample prediction.
- projection
a \((p\times ndim)\) whose columns are basis for projection.
References
Wang F, Zhang C (2007). “Feature Extraction by Maximizing the Average Neighborhood Margin.” In 2007 IEEE Conference on Computer Vision and Pattern Recognition, 1--8.
Examples
## load iris data
data(iris)
set.seed(100)
subid = sample(1:150,50)
X = as.matrix(iris[subid,1:4])
label = as.factor(iris[subid,5])
## perform ANMM on different choices of neighborhood size
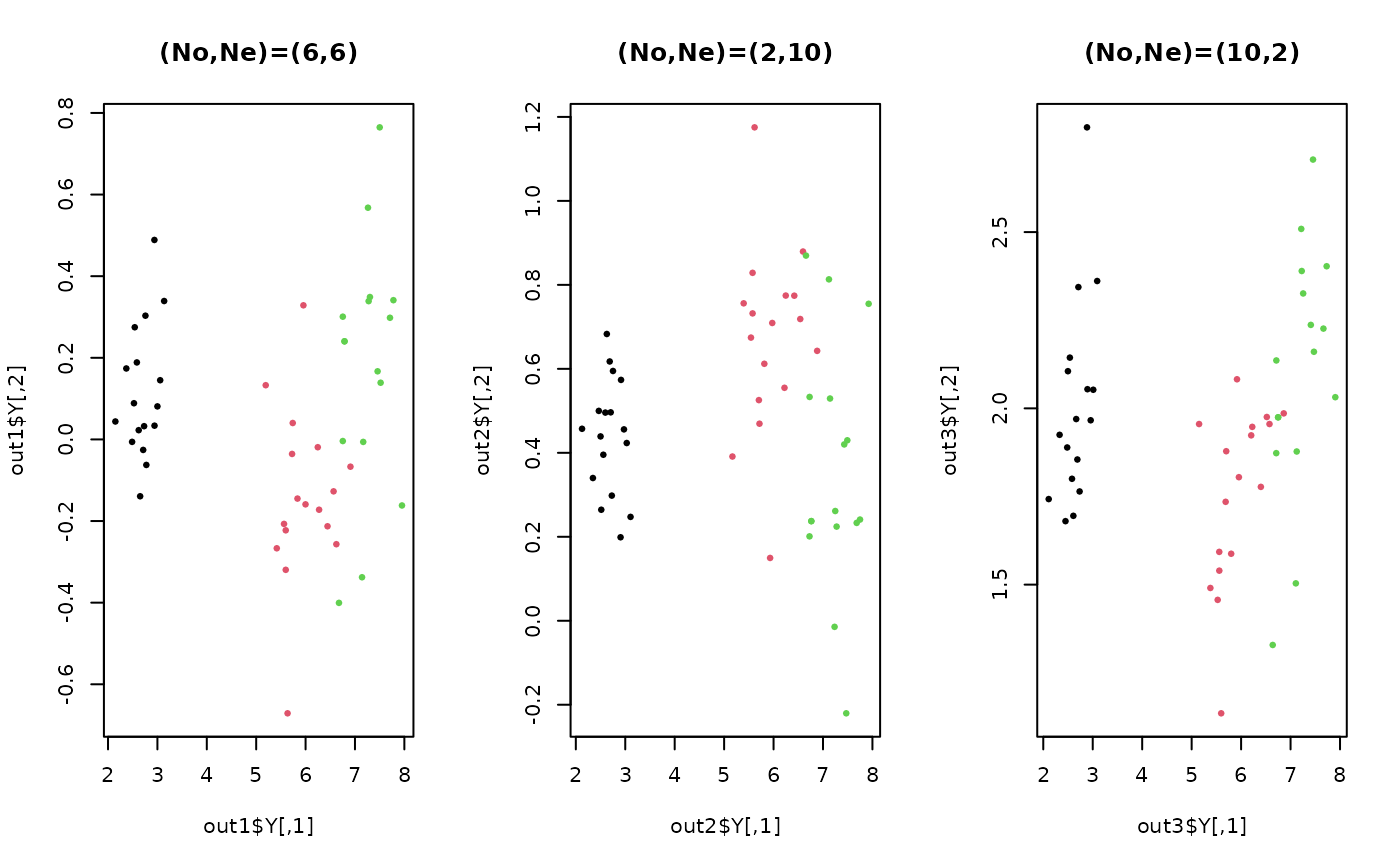
out1 = do.anmm(X, label, No=6, Ne=6)
out2 = do.anmm(X, label, No=2, Ne=10)
out3 = do.anmm(X, label, No=10,Ne=2)
## visualize
opar <- par(no.readonly=TRUE)
par(mfrow=c(1,3))
plot(out1$Y, main="(No,Ne)=(6,6)", pch=19, cex=0.5, col=label)
plot(out2$Y, main="(No,Ne)=(2,10)", pch=19, cex=0.5, col=label)
plot(out3$Y, main="(No,Ne)=(10,2)", pch=19, cex=0.5, col=label)
 par(opar)