UGFS is an unsupervised feature selection method with two parameters nbdk and varthr that it constructs
an affinity graph using local variance computation and scores variables based on PageRank algorithm.
do.ugfs(
  X,
  ndim = 2,
  nbdk = 5,
  varthr = 2,
  preprocess = c("null", "center", "scale", "cscale", "whiten", "decorrelate")
)
Arguments
- X
an \((n\times p)\) matrix or data frame whose rows are observations and columns represent independent variables.
- ndim
an integer-valued target dimension.
- nbdk
the size of neighborhood for local variance computation.
- varthr
threshold value for affinity graph construction. If too small so that the graph of variables is not constructed, it returns an error.
- preprocess
an additional option for preprocessing the data. Default is "null". See also
aux.preprocessfor more details.
Value
a named list containing
- Y
an \((n\times ndim)\) matrix whose rows are embedded observations.
- prscore
a length-\(p\) vector of score computed from PageRank algorithm. Indices with largest values are selected.
- featidx
a length-\(ndim\) vector of indices with highest scores.
- trfinfo
a list containing information for out-of-sample prediction.
- projection
a \((p\times ndim)\) whose columns are basis for projection.
References
Henni K, Mezghani N, Gouin-Vallerand C (2018). “Unsupervised Graph-Based Feature Selection via Subspace and Pagerank Centrality.” Expert Systems with Applications, 114, 46--53. ISSN 09574174.
Examples
# \donttest{
## use iris data
## it is known that feature 3 and 4 are more important.
data(iris)
iris.dat <- as.matrix(iris[,1:4])
iris.lab <- as.factor(iris[,5])
## try multiple thresholding values
out1 = do.ugfs(iris.dat, nbdk=10, varthr=0.5)
#> [1] "* do.ugfs : range of variances is [0.14,12.92]."
out2 = do.ugfs(iris.dat, nbdk=10, varthr=5.0)
#> [1] "* do.ugfs : range of variances is [0.14,12.92]."
out3 = do.ugfs(iris.dat, nbdk=10, varthr=9.5)
#> [1] "* do.ugfs : range of variances is [0.14,12.92]."
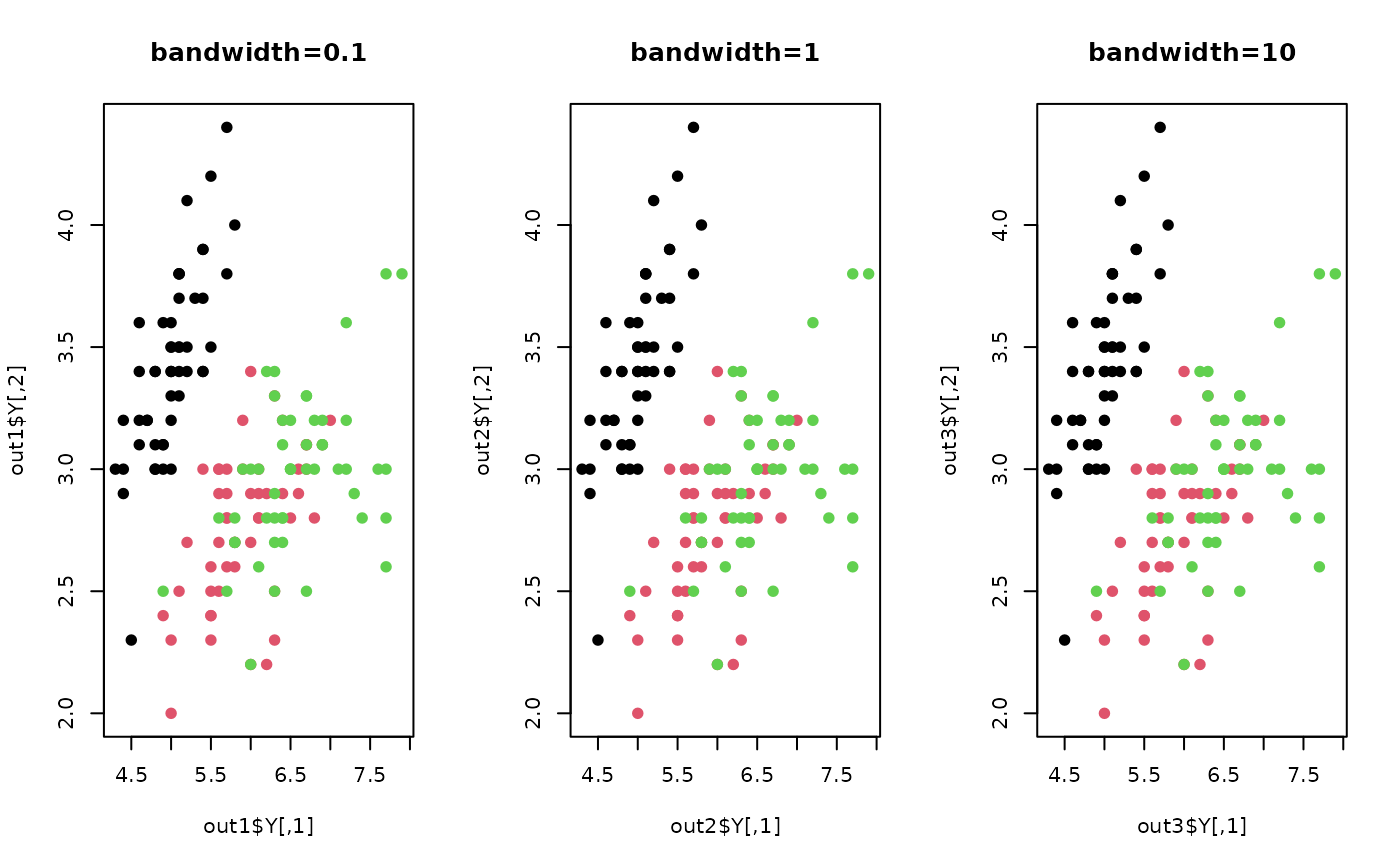
## visualize
opar <- par(no.readonly=TRUE)
par(mfrow=c(1,3))
plot(out1$Y, pch=19, col=iris.lab, main="bandwidth=0.1")
plot(out2$Y, pch=19, col=iris.lab, main="bandwidth=1")
plot(out3$Y, pch=19, col=iris.lab, main="bandwidth=10")
 par(opar)
# }
par(opar)
# }