Constraint Score is a filter-type algorithm for feature selection using pairwise constraints. It first marks all pairwise constraints as same- and different-cluster and construct a feature score for both constraints. It takes ratio or difference of feature score vectors and selects the indices with smallest values. Graph laplacian is constructed for approximated nonlinear manifold structure.
do.cscoreg(X, label, ndim = 2, score = c("ratio", "difference"), lambda = 0.5)Arguments
- X
an \((n\times p)\) matrix or data frame whose rows are observations and columns represent independent variables.
- label
a length-\(n\) vector of class labels.
- ndim
an integer-valued target dimension.
- score
type of score measures from two score vectors of same- and different-class pairwise constraints;
"ratio"and"difference"method. See the paper from the reference for more details.- lambda
a penalty value for different-class pairwise constraints. Only valid for
"difference"scoring method.
Value
a named Rdimtools S3 object containing
- Y
an \((n\times ndim)\) matrix whose rows are embedded observations.
- cscore
a length-\(p\) vector of constraint scores. Indices with smallest values are selected.
- featidx
a length-\(ndim\) vector of indices with highest scores.
- projection
a \((p\times ndim)\) whose columns are basis for projection.
- algorithm
name of the algorithm.
References
Zhang D, Chen S, Zhou Z (2008). “Constraint Score: A New Filter Method for Feature Selection with Pairwise Constraints.” Pattern Recognition, 41(5), 1440--1451.
See also
Examples
# \donttest{
## use iris data
## it is known that feature 3 and 4 are more important.
data(iris)
set.seed(100)
subid    = sample(1:150,50)
iris.dat = as.matrix(iris[subid,1:4])
iris.lab = as.factor(iris[subid,5])

## try different strategy
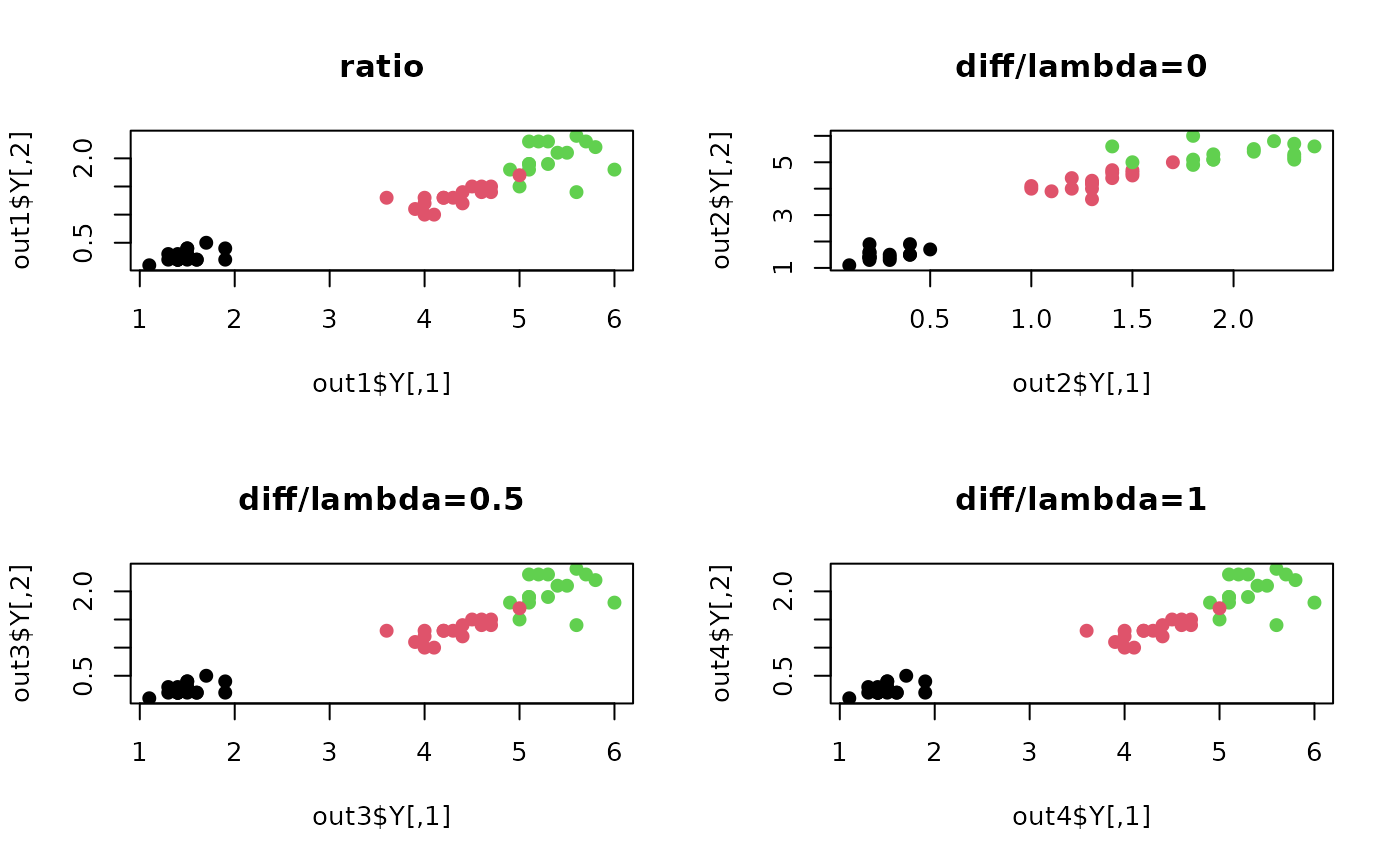
out1 = do.cscoreg(iris.dat, iris.lab, score="ratio")
out2 = do.cscoreg(iris.dat, iris.lab, score="difference", lambda=0)
out3 = do.cscoreg(iris.dat, iris.lab, score="difference", lambda=0.5)
out4 = do.cscoreg(iris.dat, iris.lab, score="difference", lambda=1)

## visualize
opar <- par(no.readonly=TRUE)
par(mfrow=c(2,2))
plot(out1$Y, pch=19, col=iris.lab, main="ratio")
plot(out2$Y, pch=19, col=iris.lab, main="diff/lambda=0")
plot(out3$Y, pch=19, col=iris.lab, main="diff/lambda=0.5")
plot(out4$Y, pch=19, col=iris.lab, main="diff/lambda=1")

par(opar)
# }